
The Verisian Tracer - Getting Started Tutorial
Try the Tracer for Free
To follow along with this tutorial, create your private trial environment for free to explore your own logs, or head on over to our free demo that contains example log analyses. To get started in your trial environment, please go through our trial tutorial to have your own logs analyzed within a few minutes.
Tracer Overview
The Tracer is composed of three panels that you can resize according to your needs. The panel on the top right shows the library and file (Overview Graph tab), and datasets/variable graphs (Graph tab). After selecting a node in the graph, the left panel will display the code of the file, or the code that generated the selected dataset (note the area highlighting the exact step when applicable). The panel on the bottom right will list additional informationthat are associated with the creation of a selected file, dataset or variable.
The Overview Graph
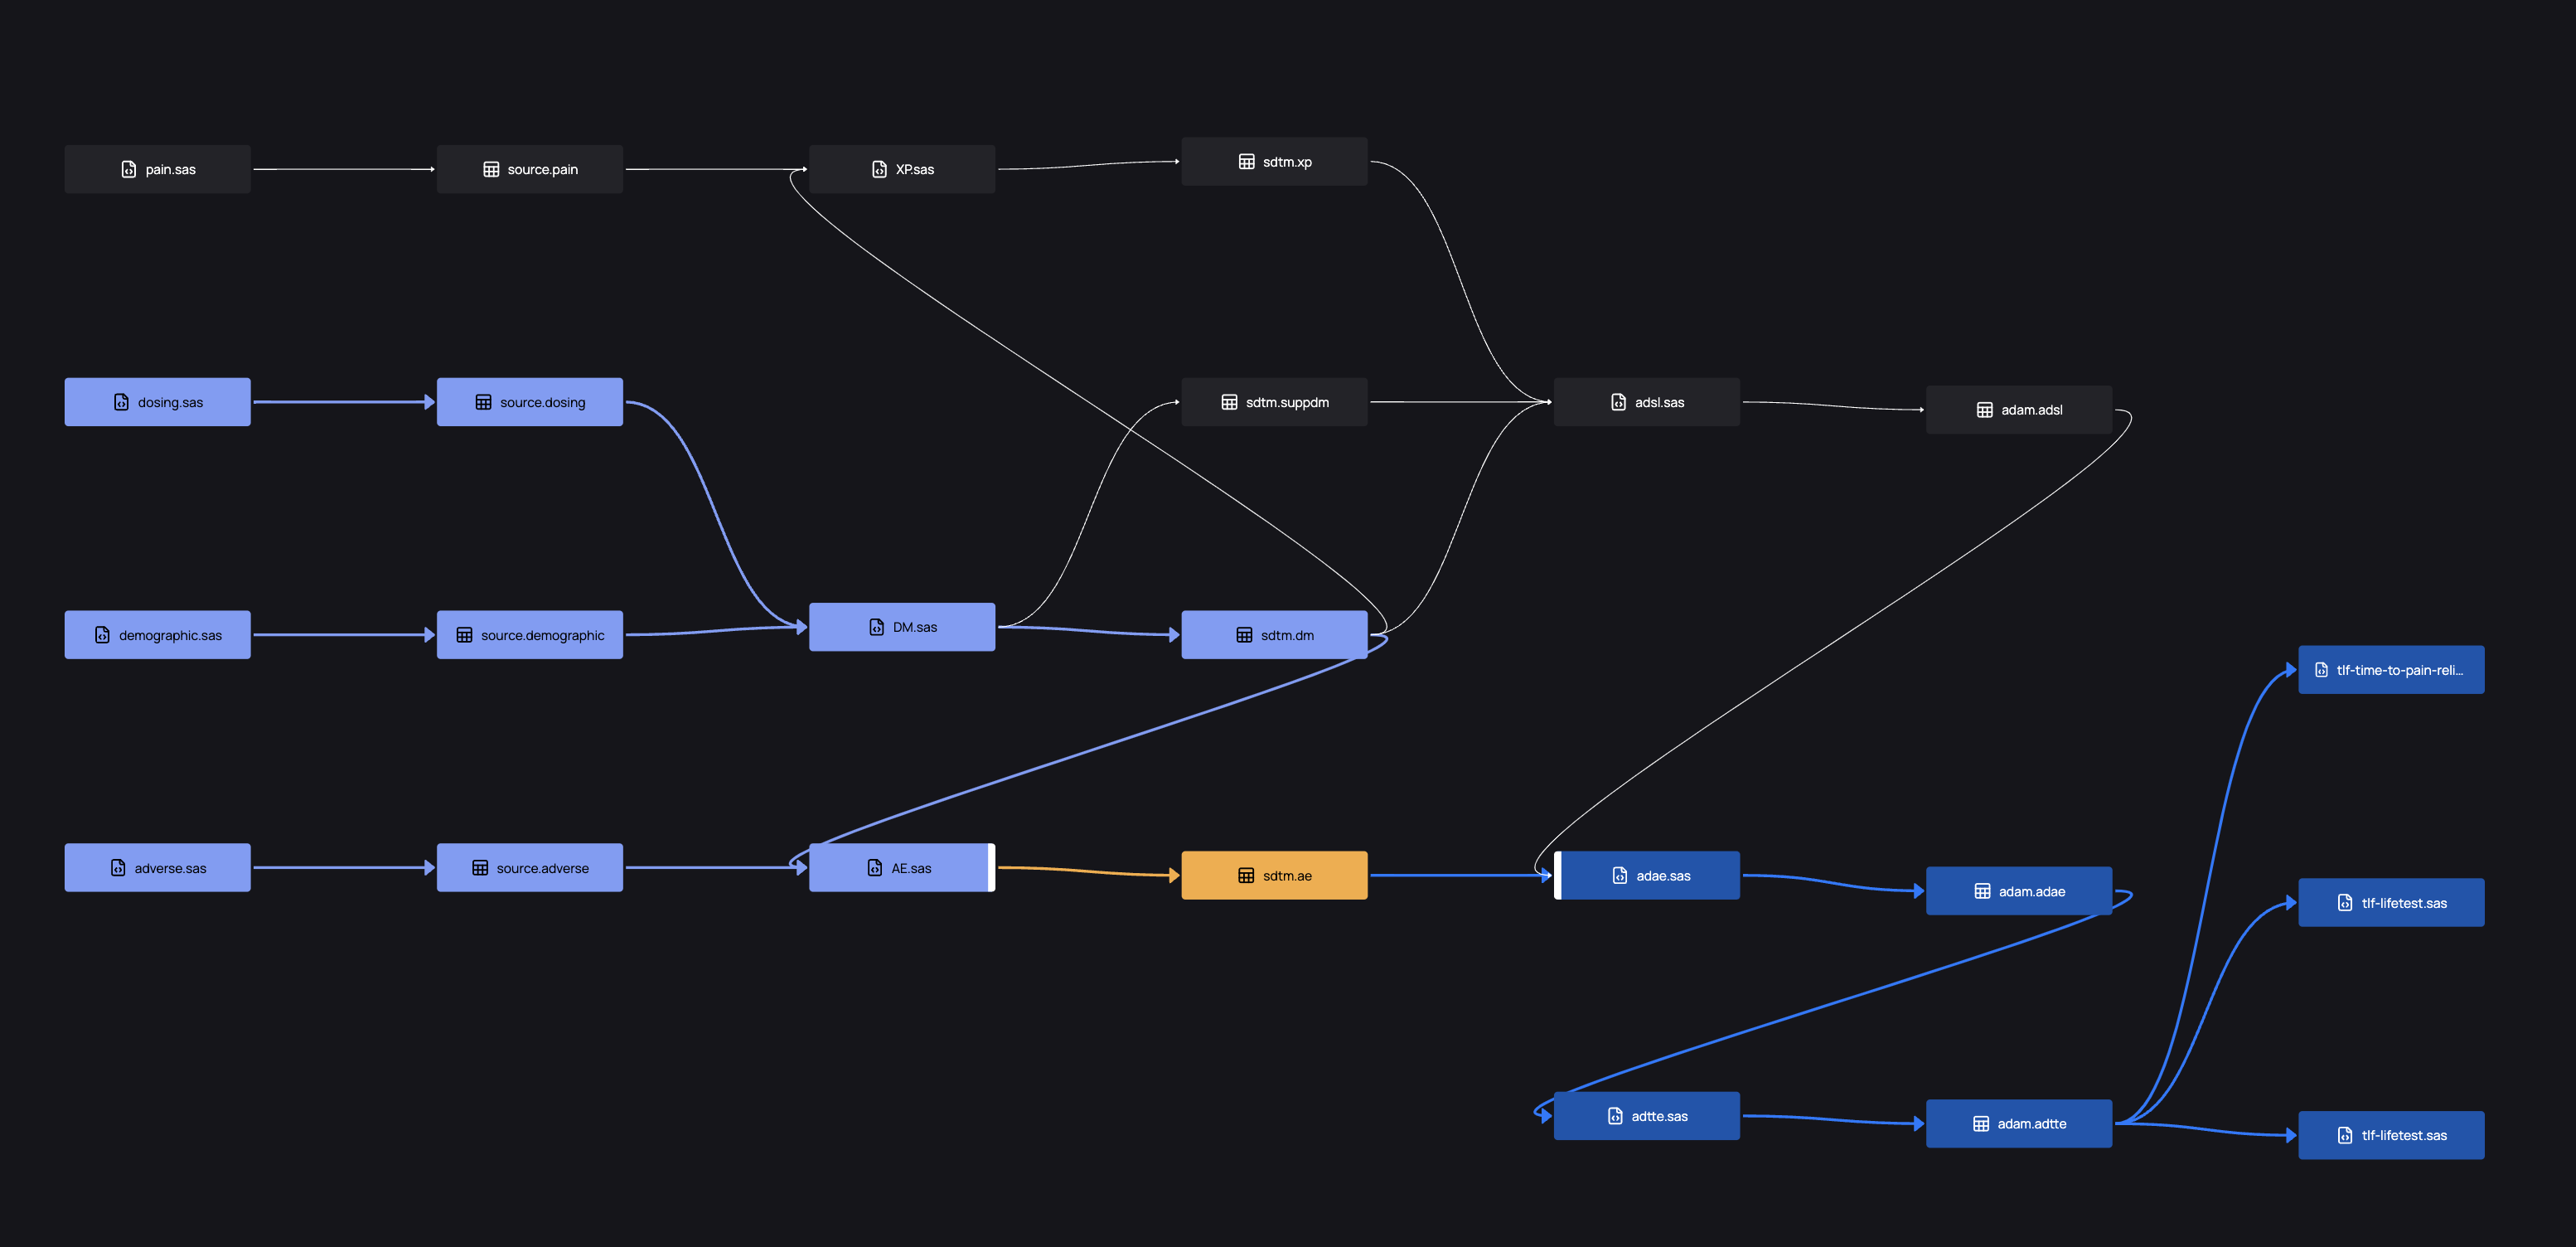
The Overview Graph displays libraries and files in "columns" within the graph, so that all nodes aligned horizontally are part of a single library. In the following example, the ex dataset in the sdtm library is selected (orange). Its dependencies are shown in light blue, and all downstream datasets and files that depend on it shown in dark blue. This serves to provide a comprehensive overview of how files and libraries interact in your study.
The Graph
Each node in the Graph below represents a dataset that is created during the analysis of your study. They are connected whenever one dataset is a dependency, or "gives rise to", another dataset. For example, the selected adef dataset is created in the displayed data step, the set statement specifying its upstream dependencies EMPTY_ADEF and adef:
In this way, the Tracer displays the full dataset provenance: all upstream dependencies of any selected dataset in light blue, and all datasets downstream in dark blue. All datasets that are part of the study analysis, but do not serve as dependencies and are not influenced by the selected dataset remain grey in the graph to illustrate that they do not interact with your current selection:
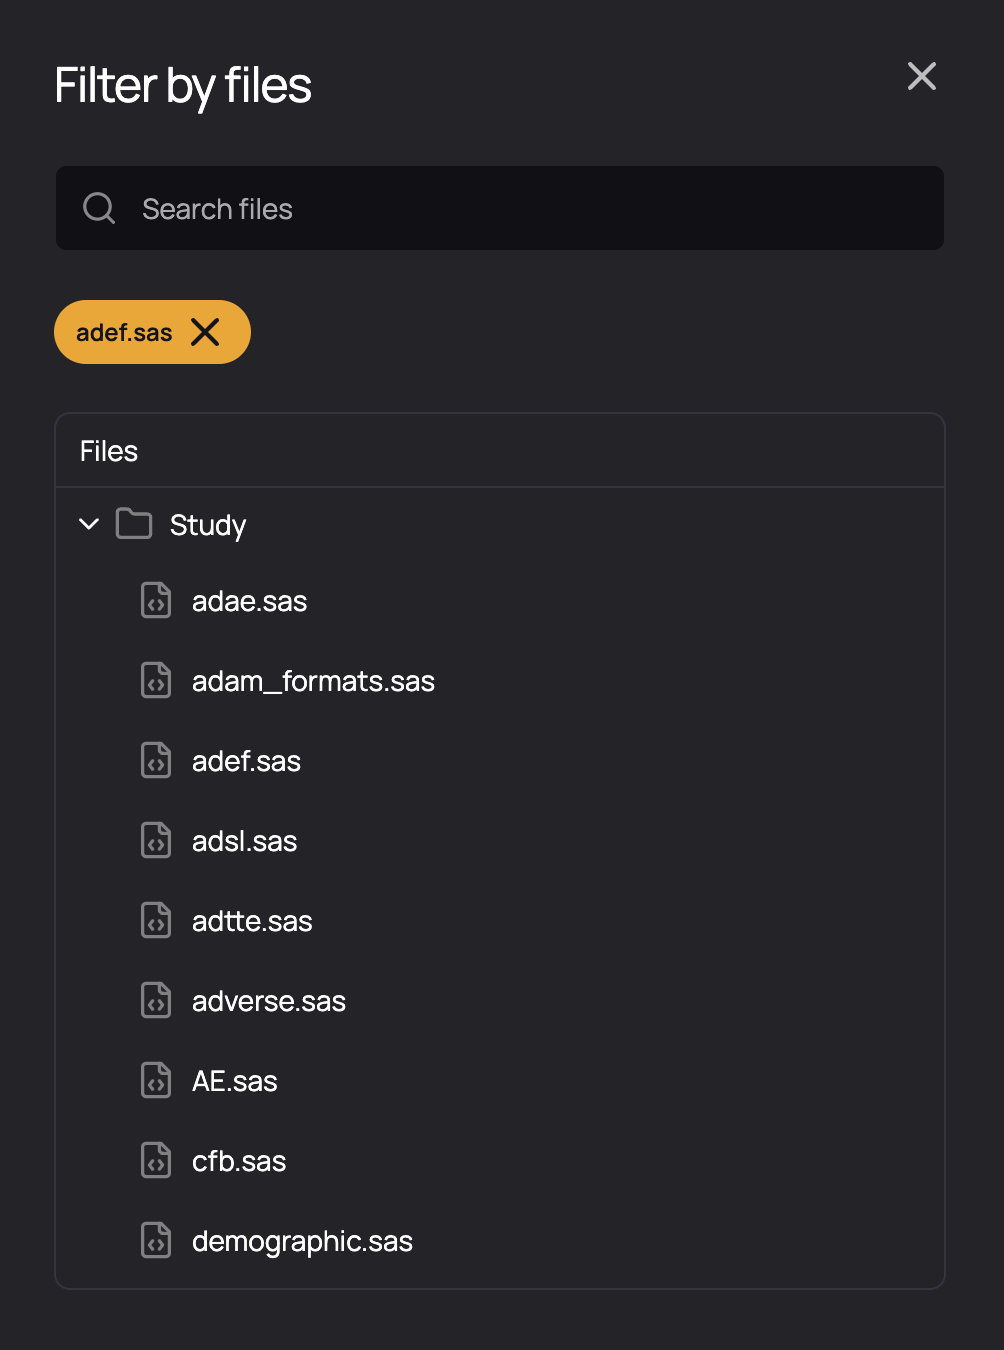
Filter by File
Since code traceability means that we represent every single piece of code and every transformation, visualizing all datasets for a full study can be very overwhelming, resulting in thousands of nodes in the graph. To make the information interpretable, we can filter the full traceability graph by file. To do so, select the code file icon in the Graph panel and then search for and select a file of interest:
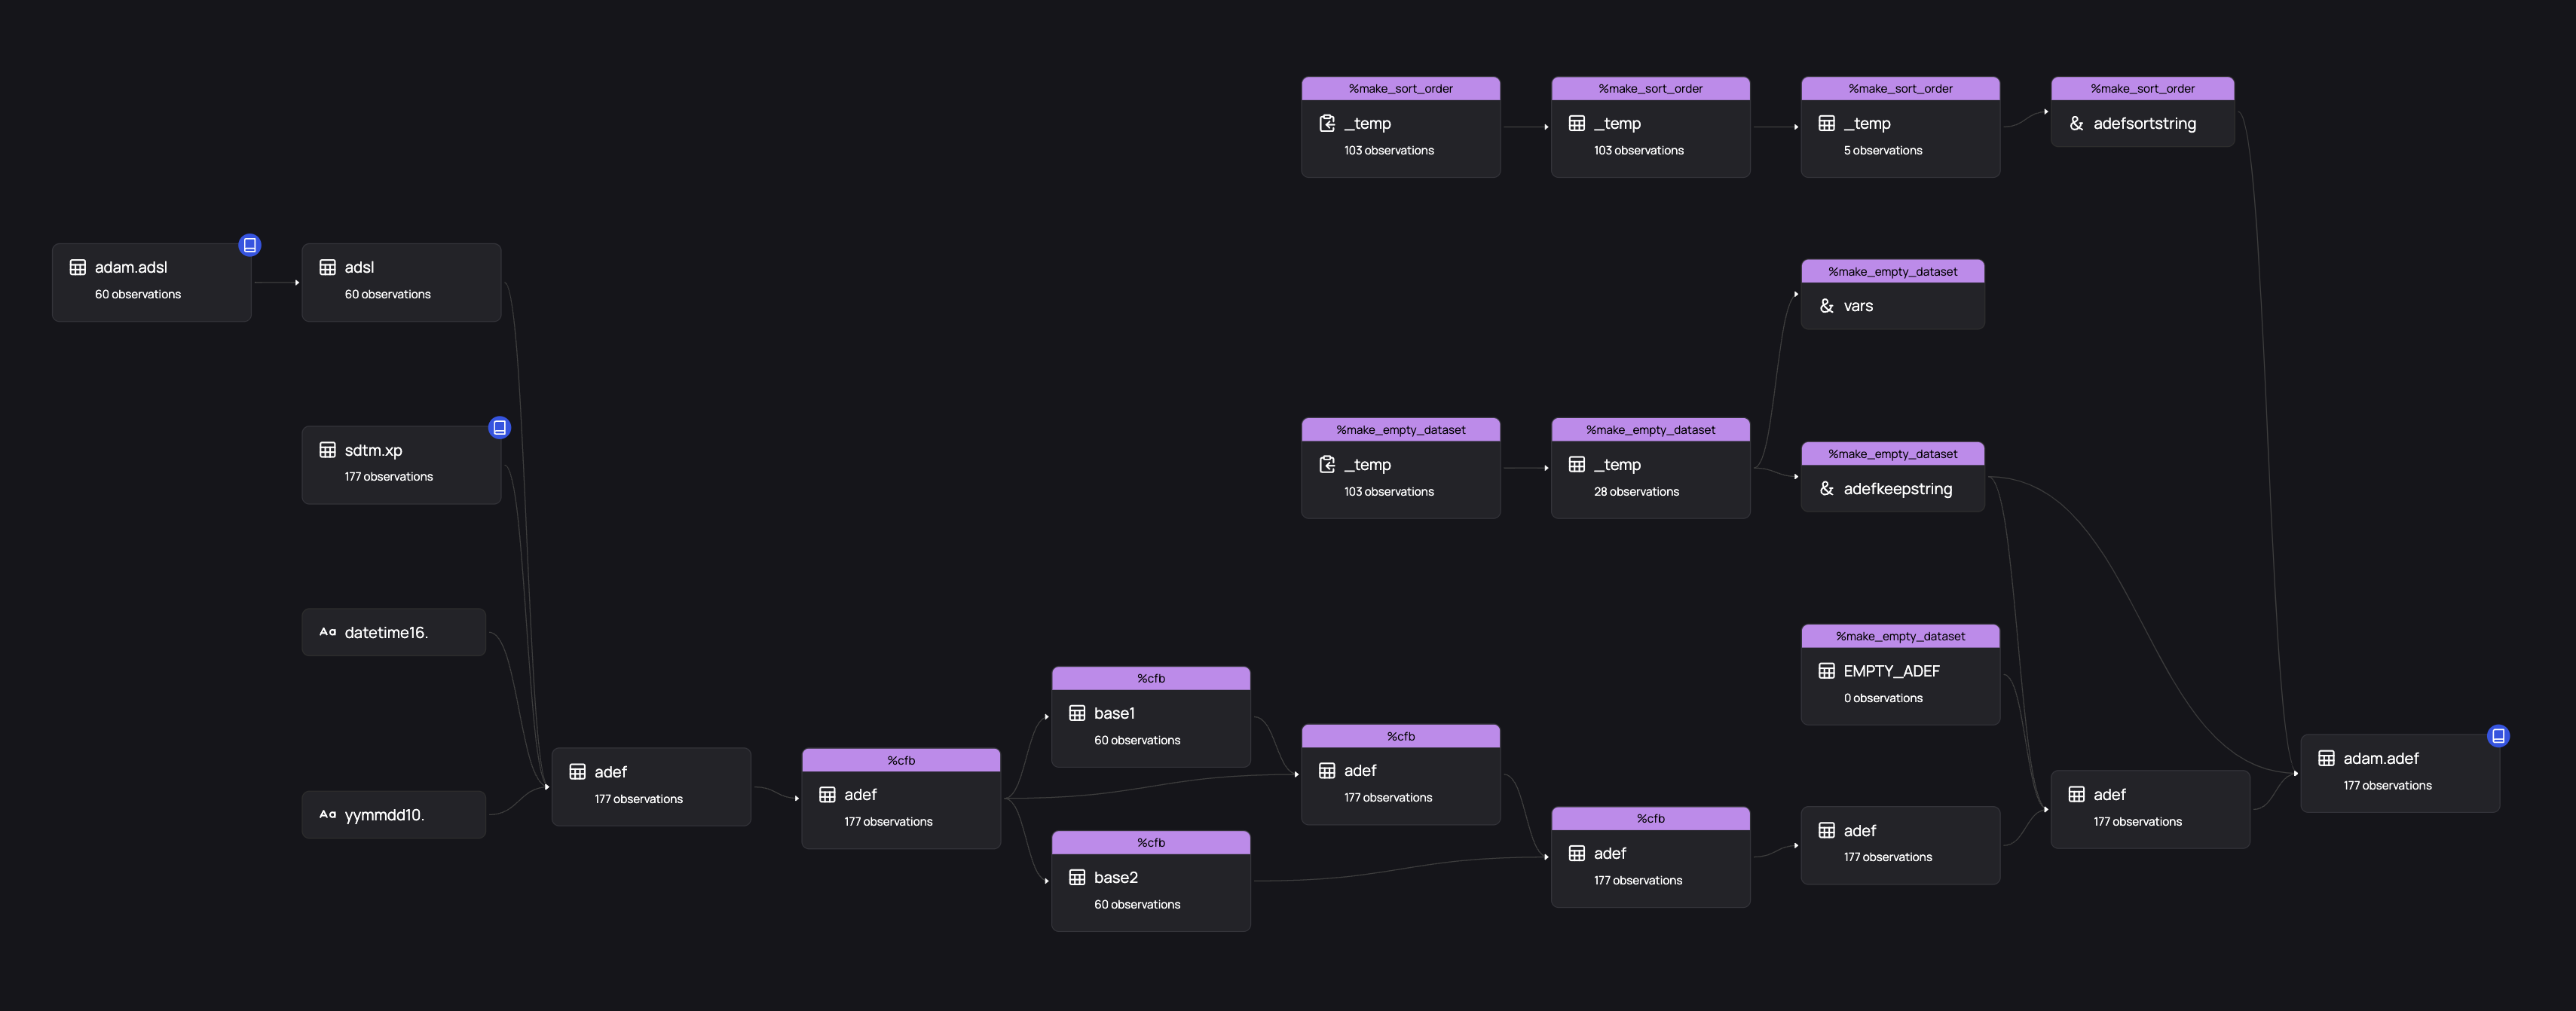
The resulting filtered graph contains all datasets created during the execution of the file. Upstream dependencies are marked with a green checkmark if their origin and traceability information is known, and a question mark if that dependency is unmet. Any datasets written to libraries are marked with a blue library icon, and "final" datasets that are not exported to a library with a white arrow:
For any of the upstream dependencies that are known, you can expand the traceability graph by selecting it and clicking the icon appearing in the top right ("Add file to selection").
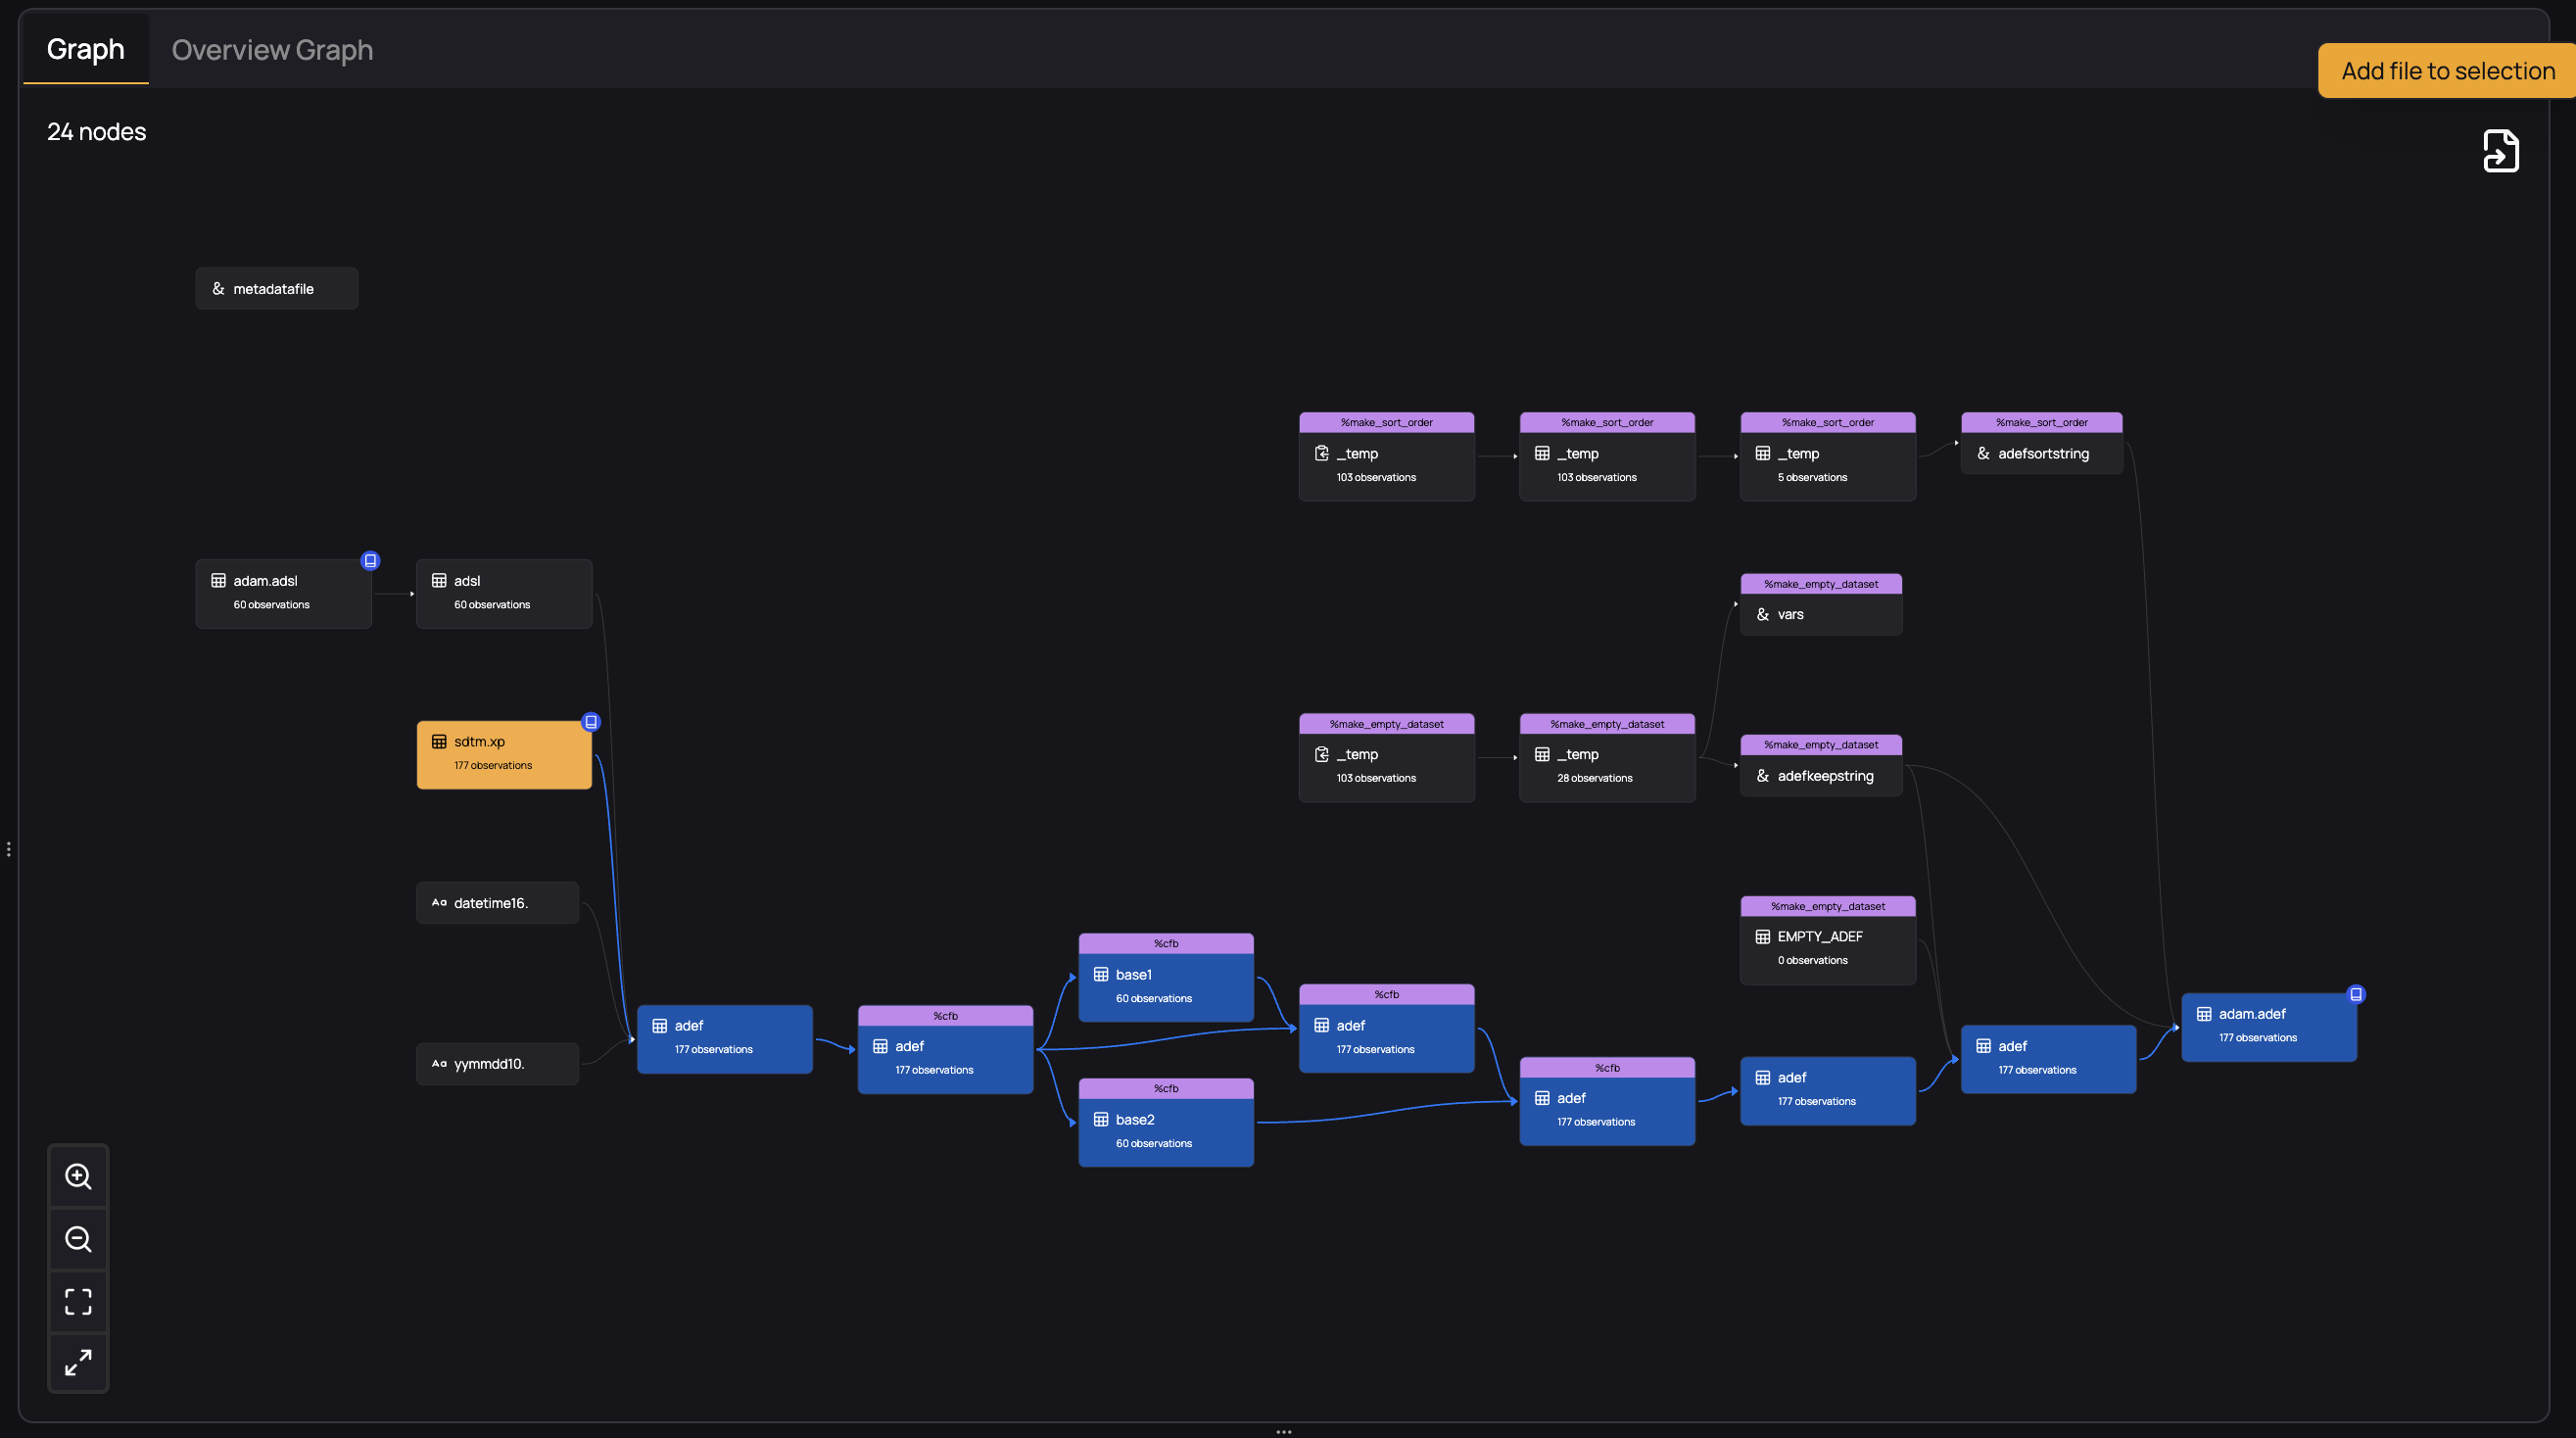
The resulting graph now shows the expanded graph, again highlighting upstream dependencies as appropriate.
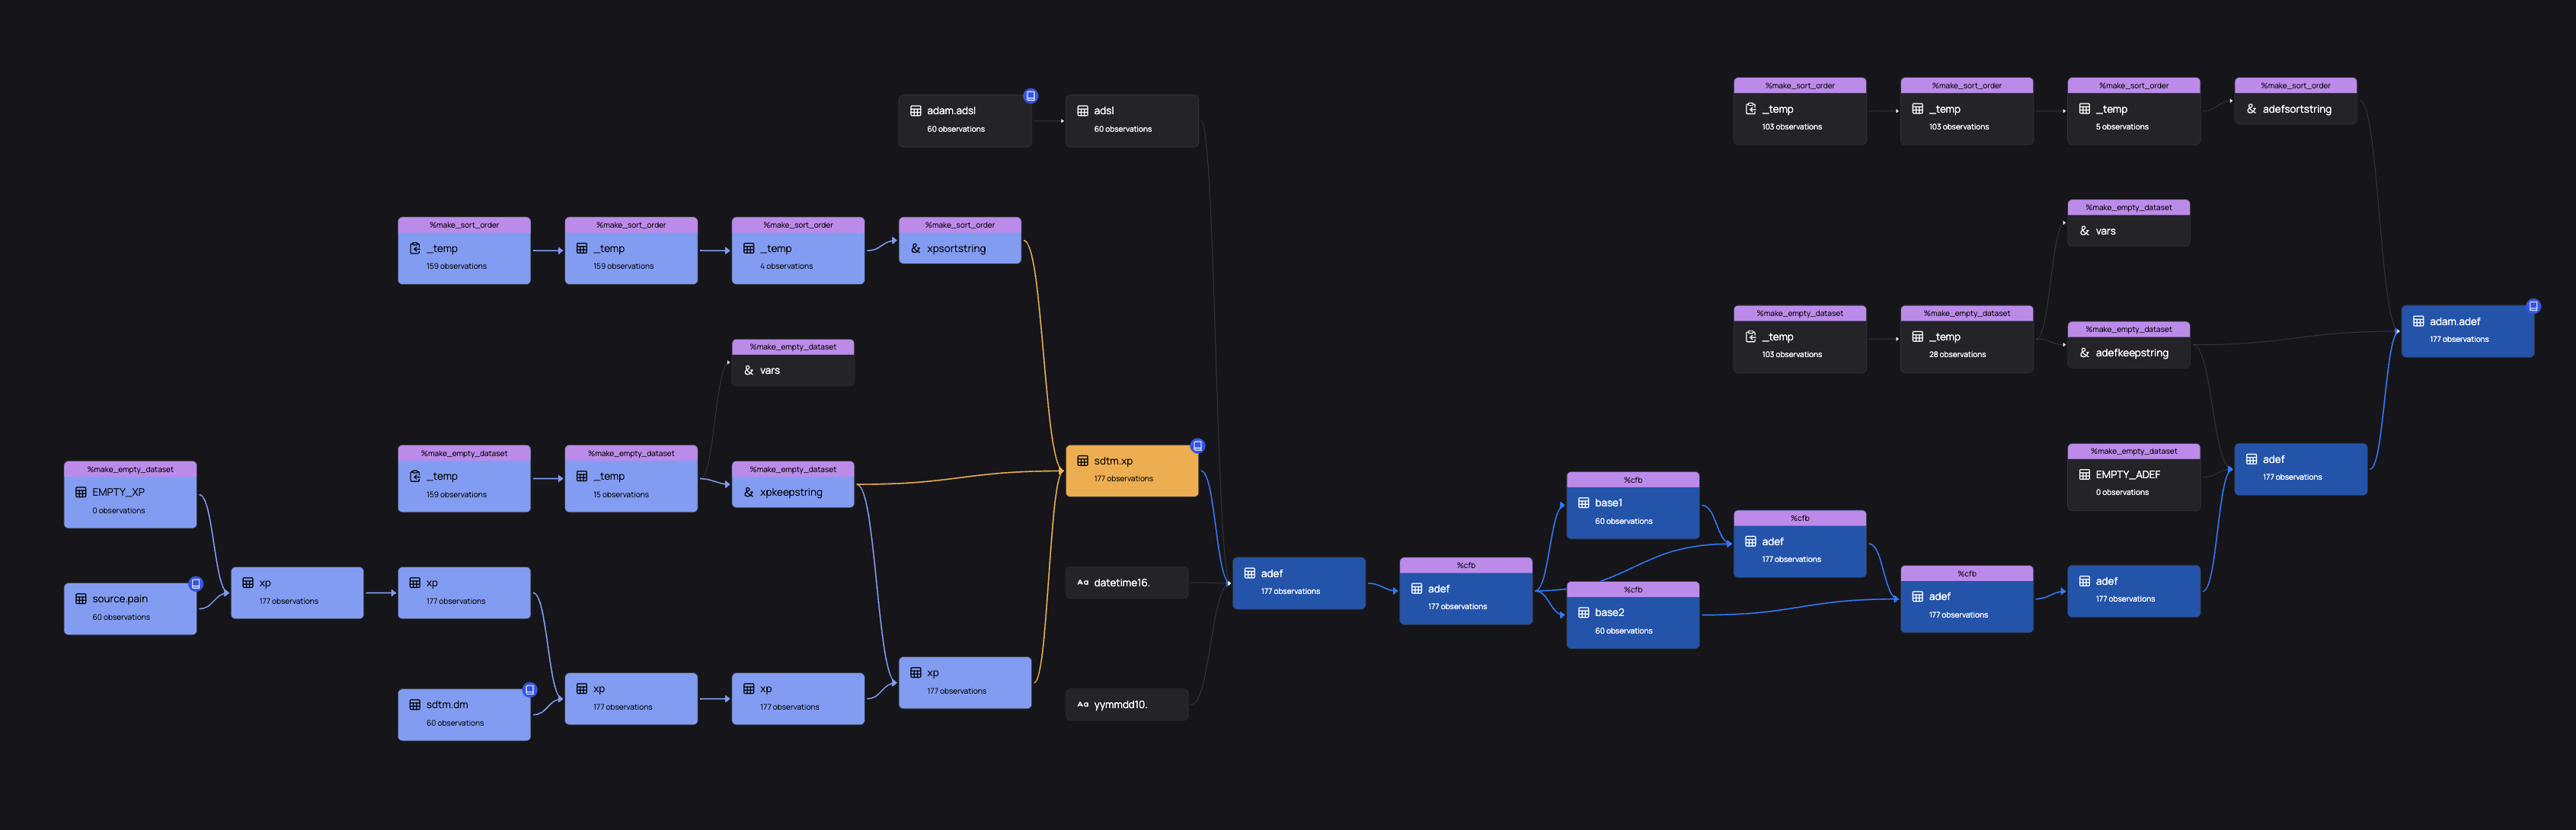
This process allows you to start on a final TLF definition and trace upwards all the way to SDTM and raw data - in fact, as far as the logs go.
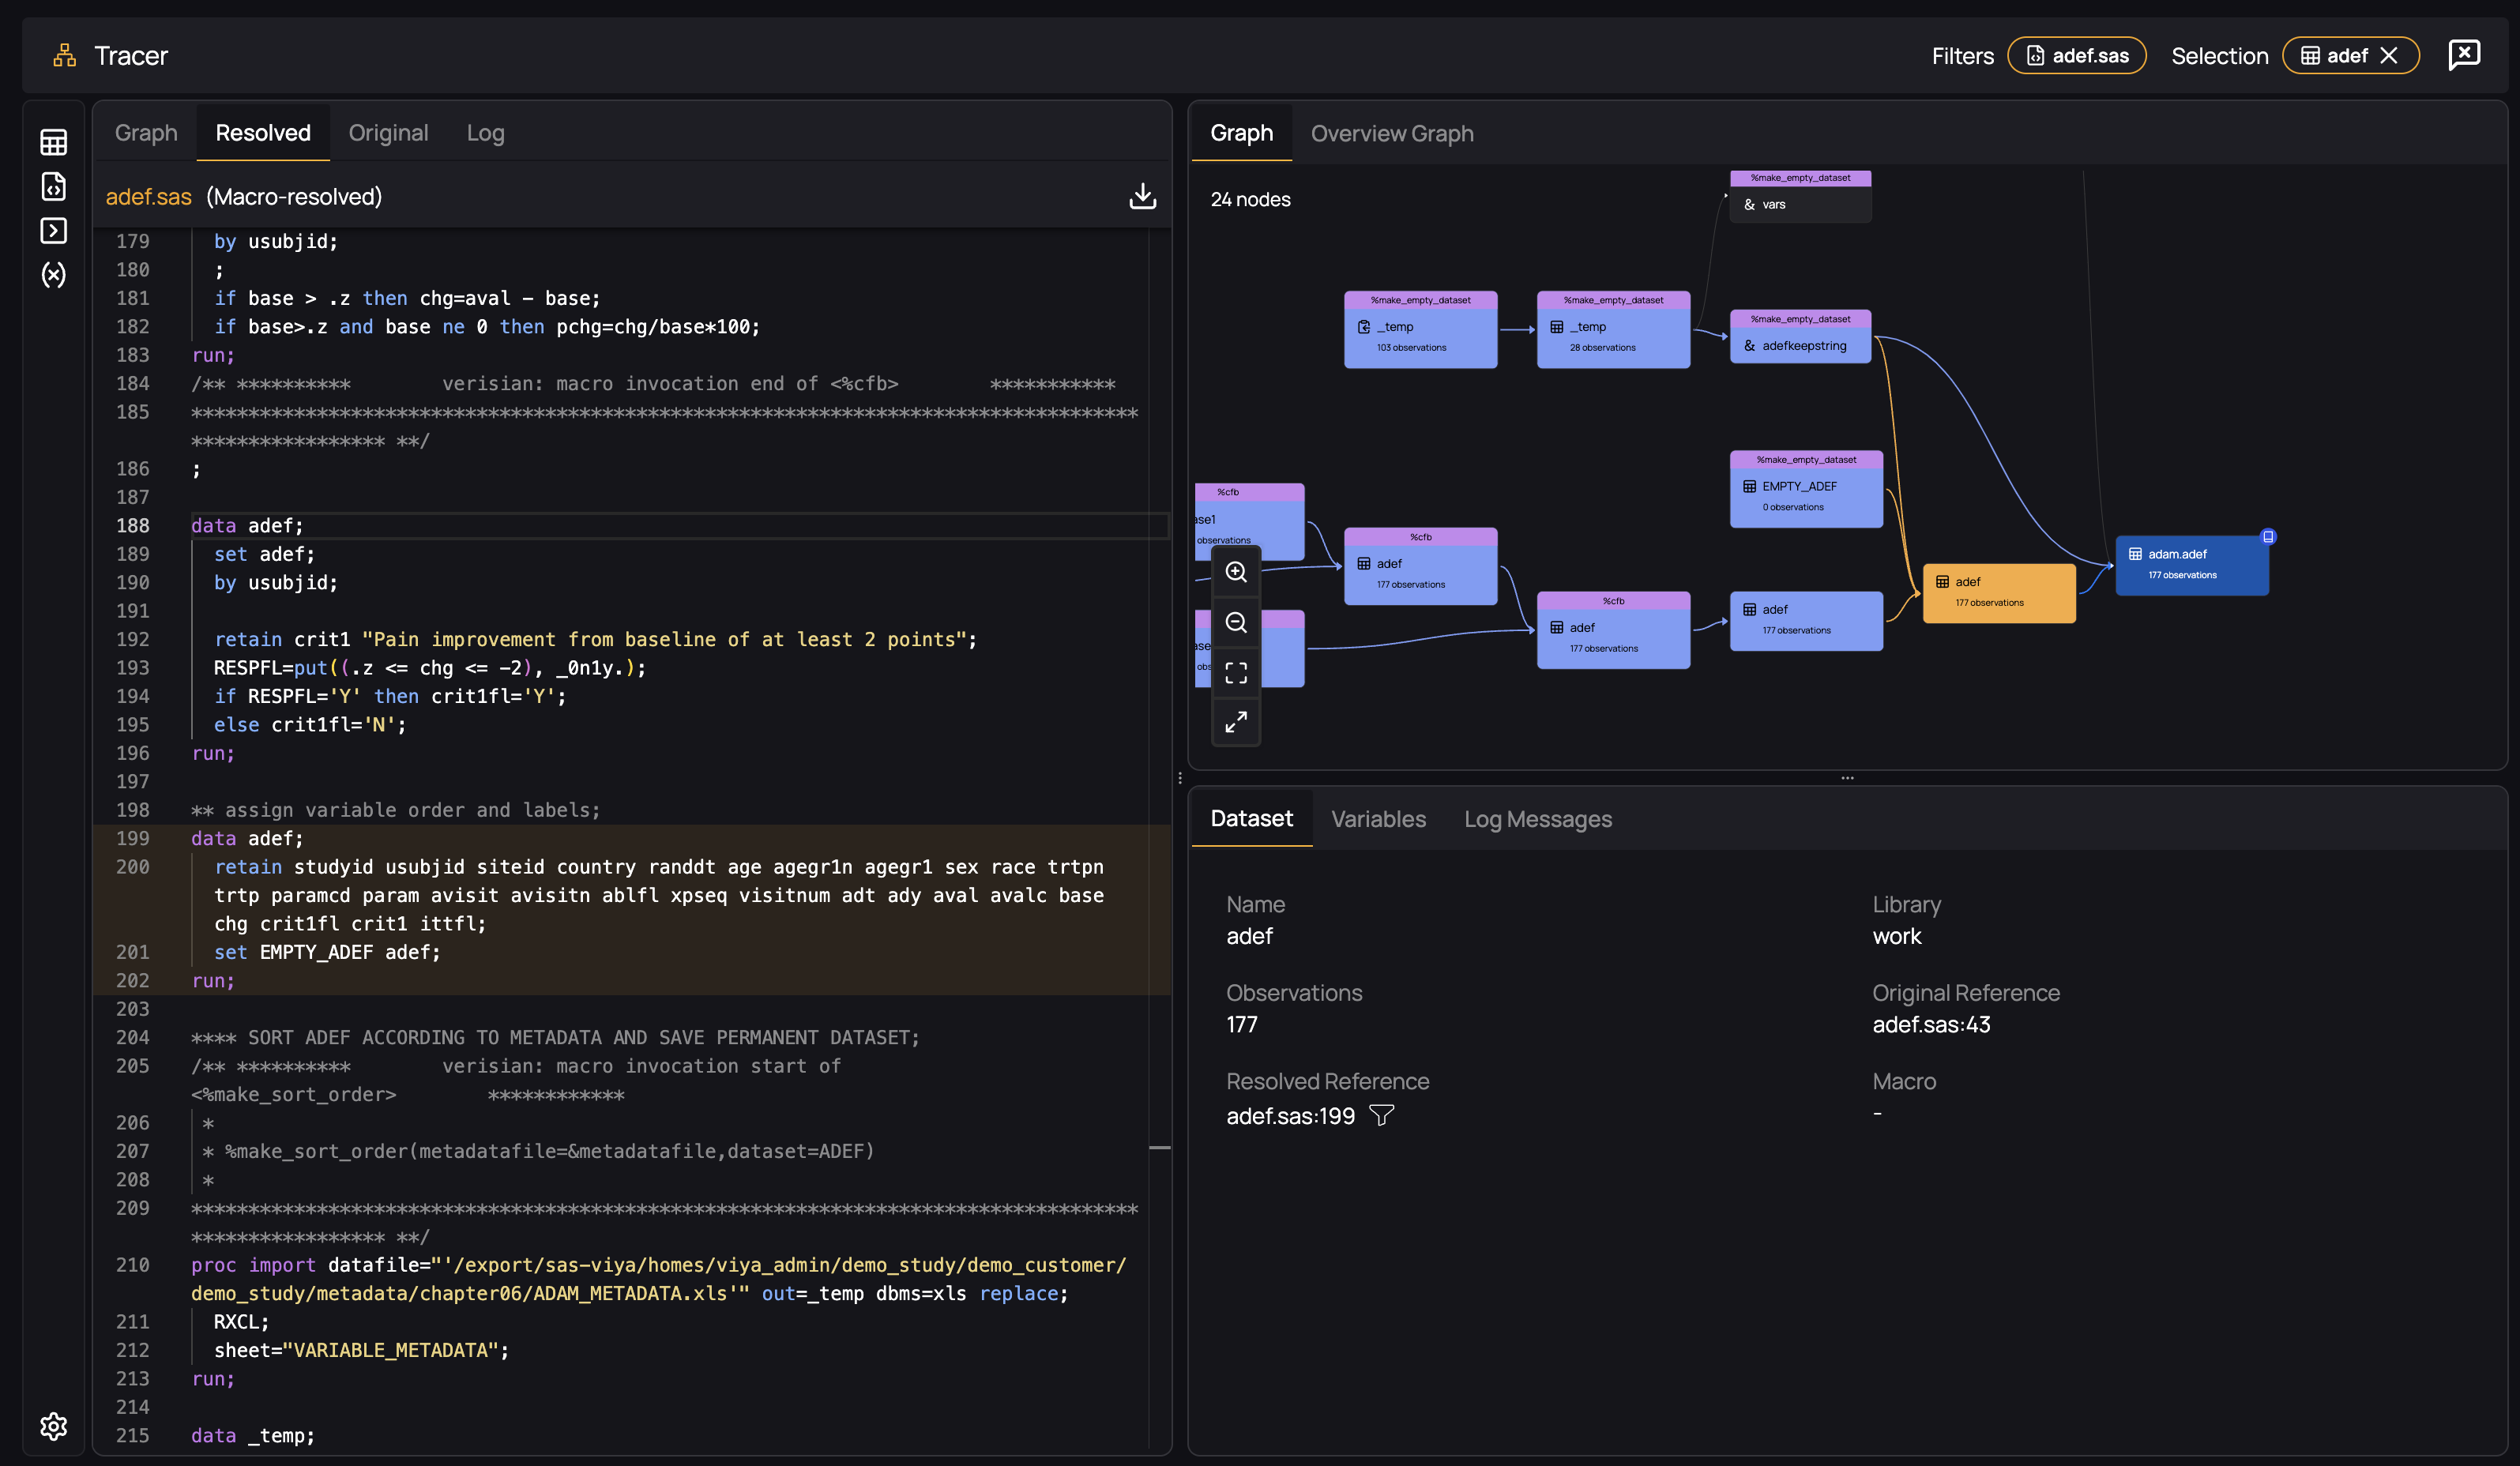
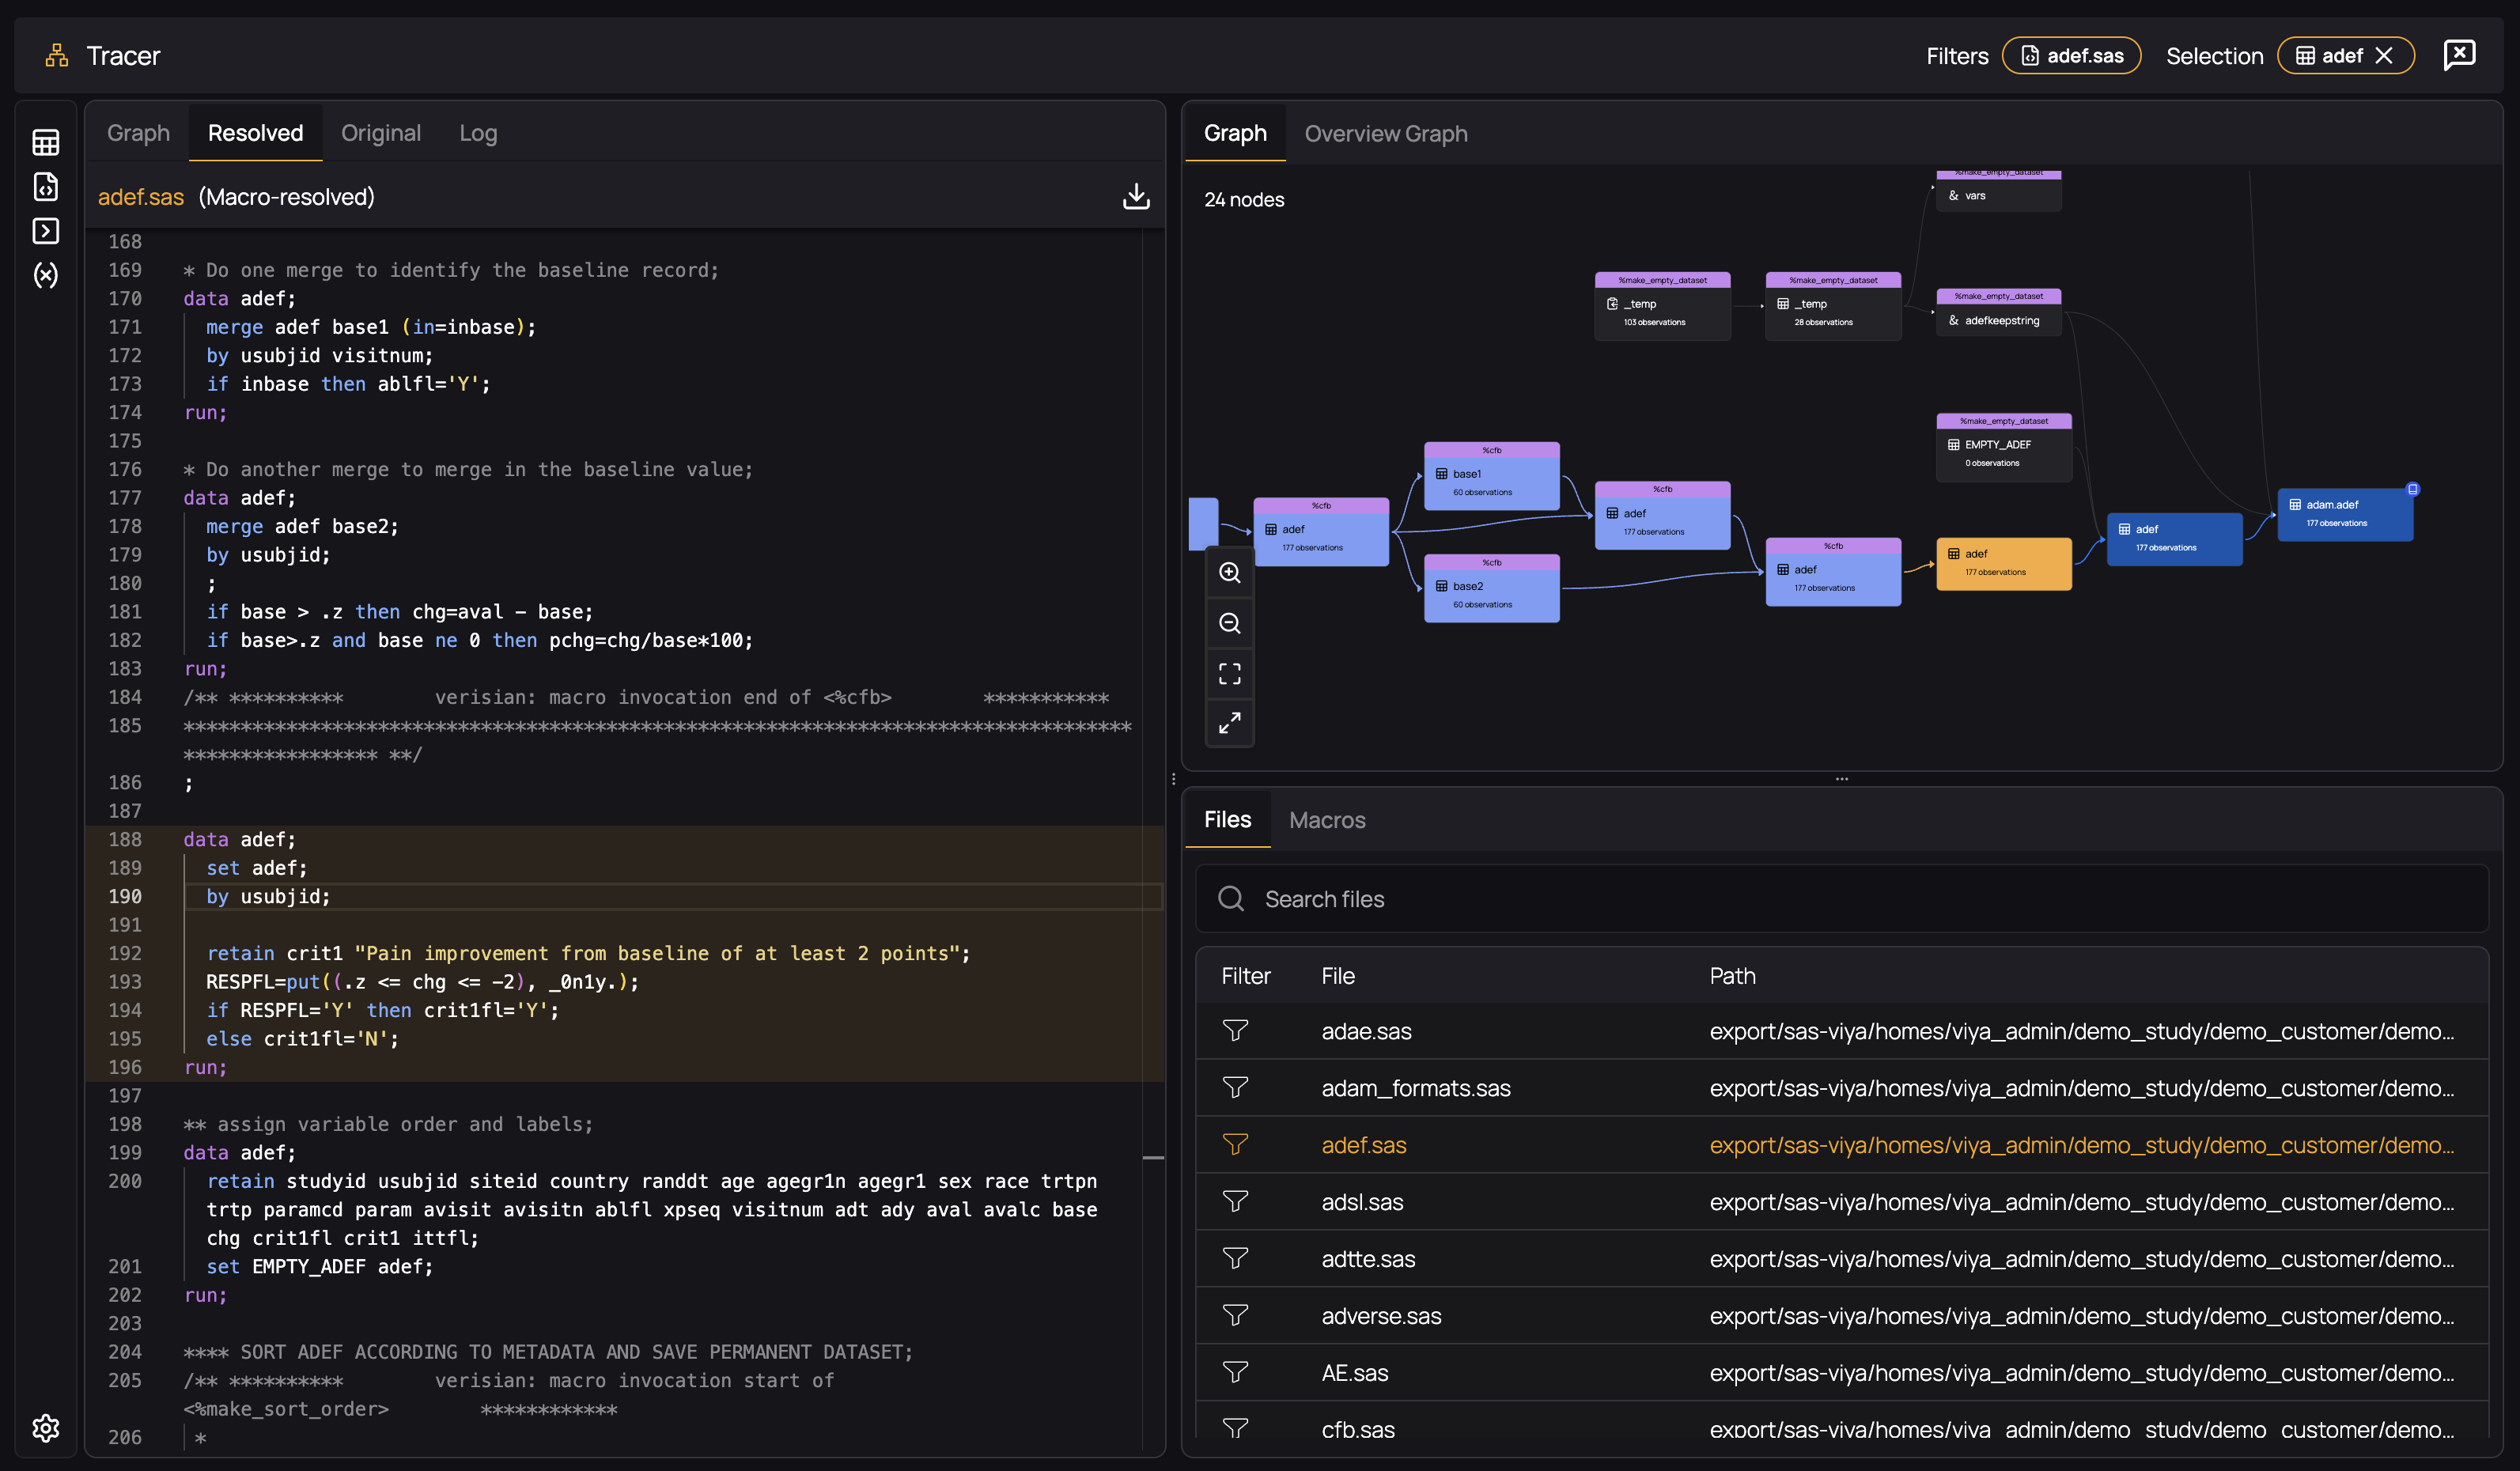
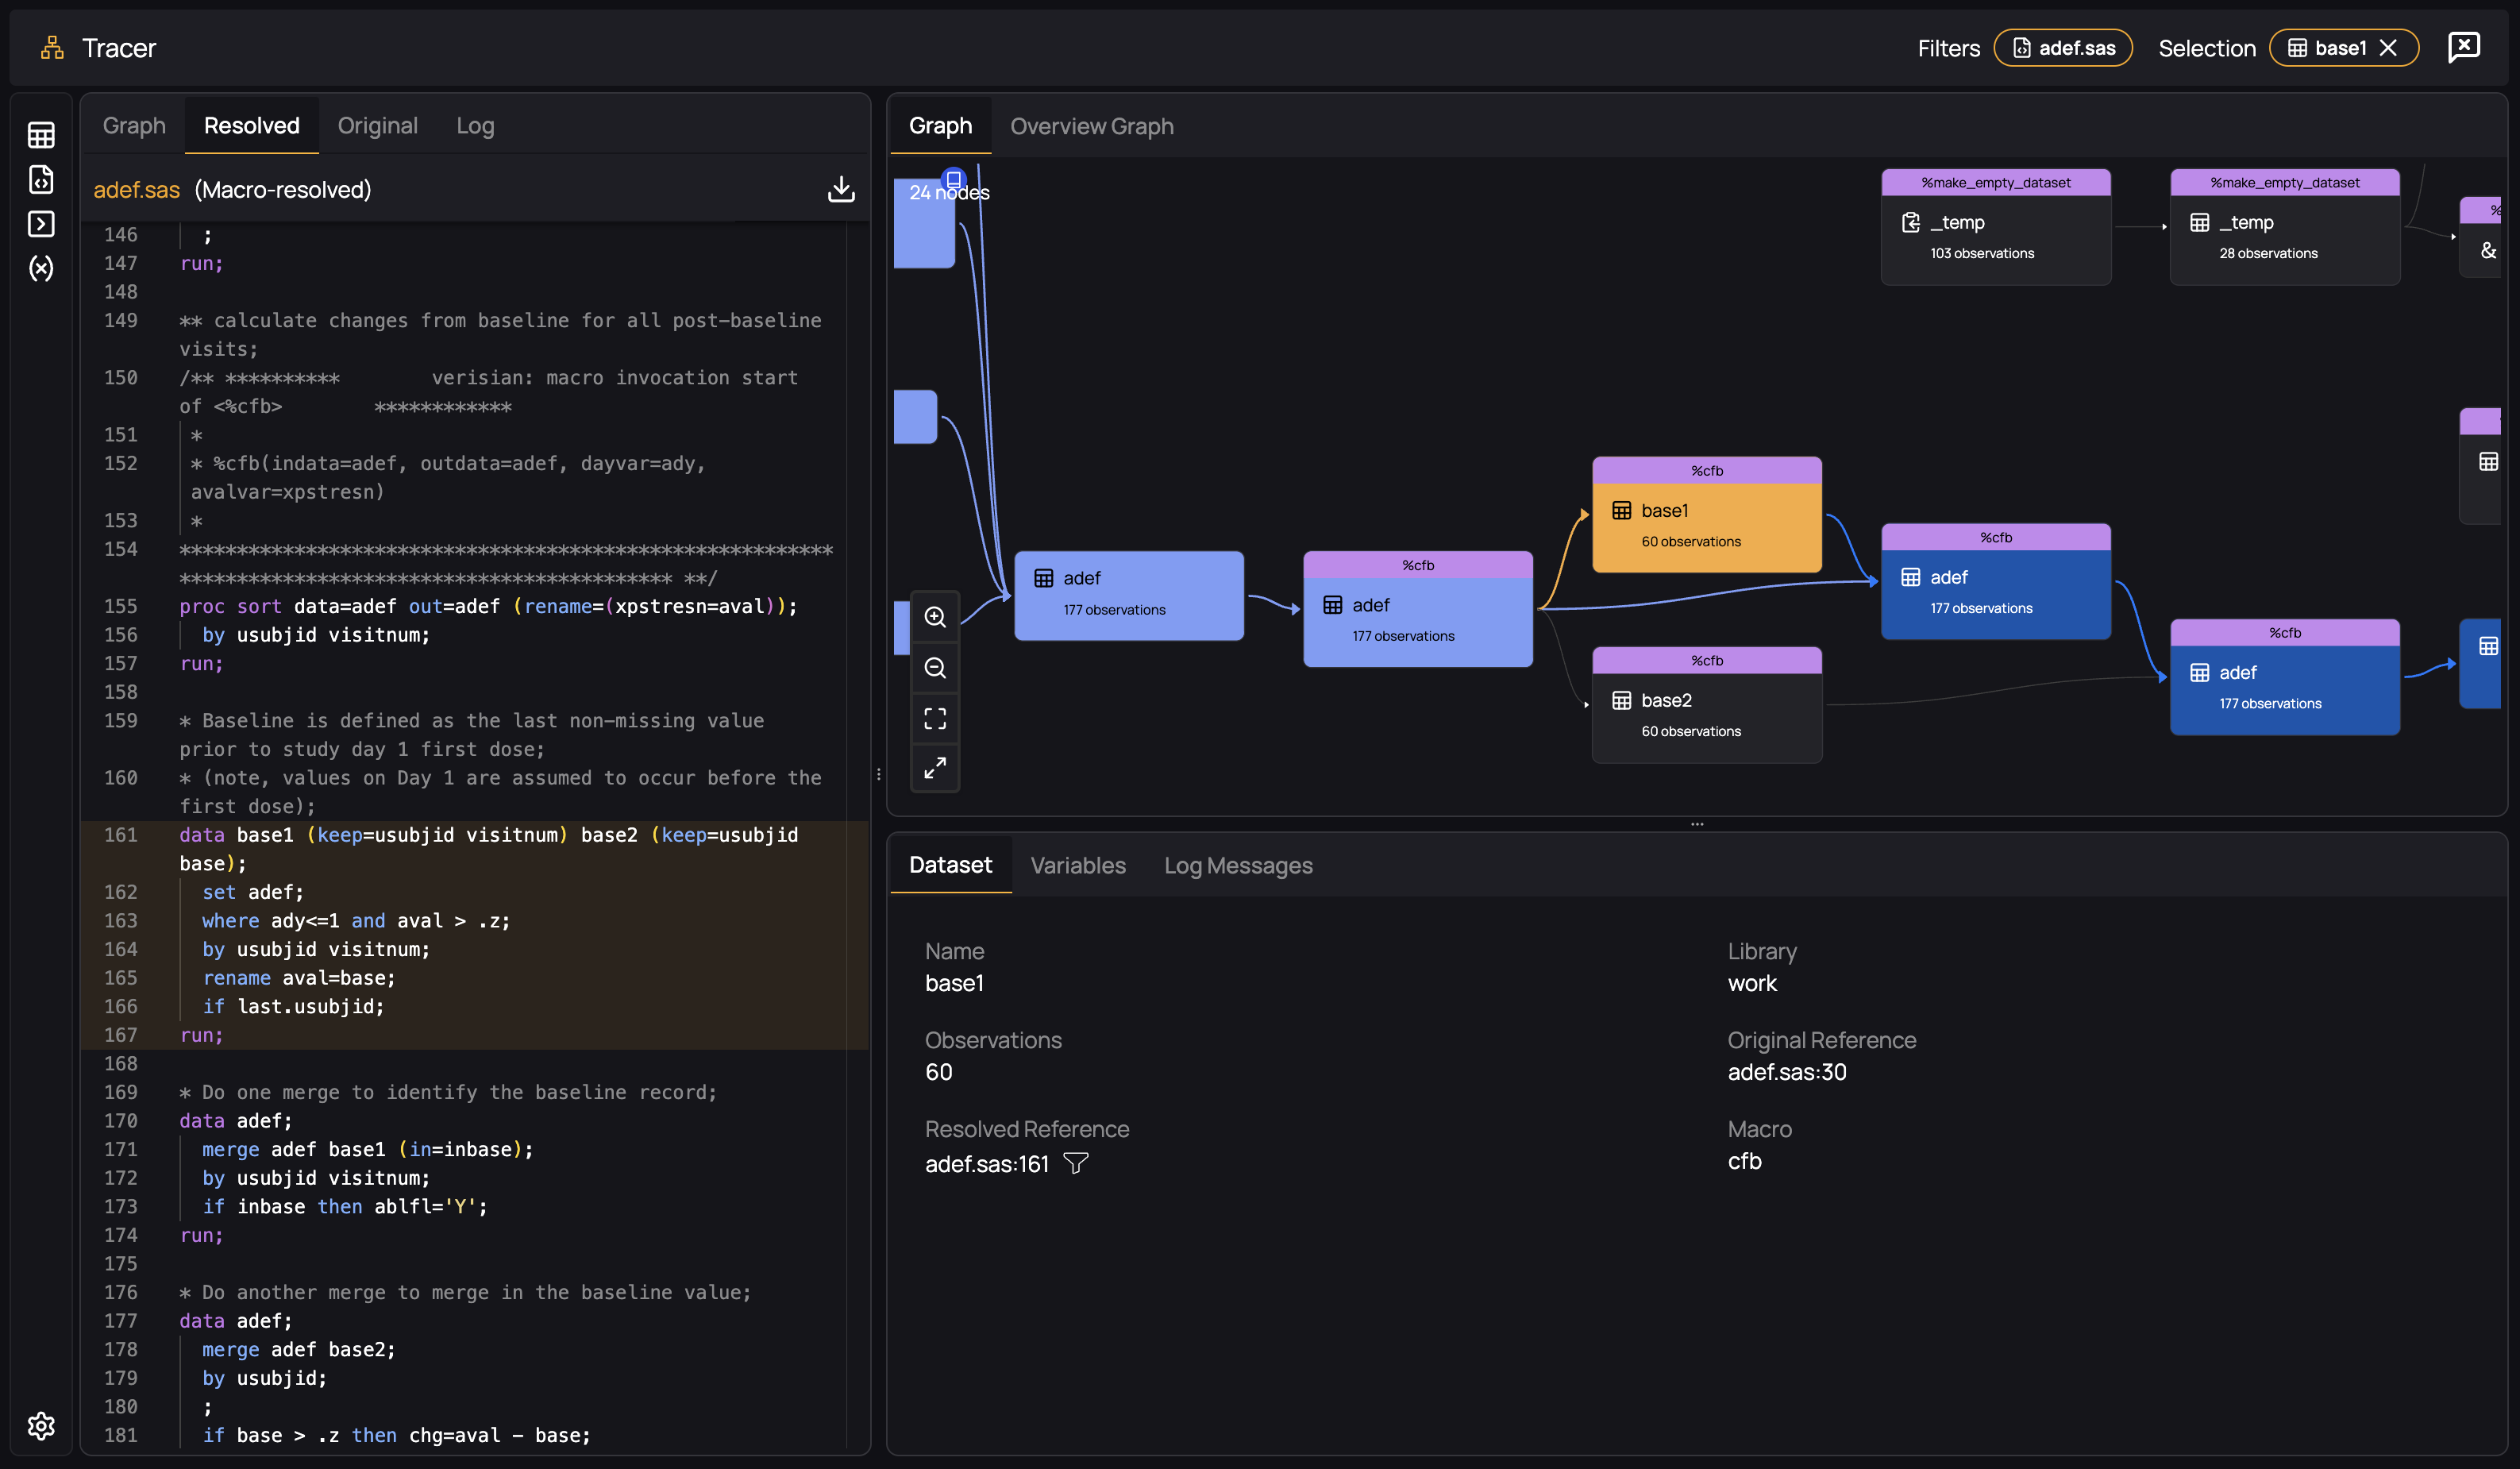
Macro Resolution
As long as MPRINT is enabled during the execution of your code, Verisian will "resolve" macro invocations by retrieving the generated and executed code and adding it into your file, as if you had written the generated code yourself. For example, consider the following dataset, which is created during the execution of the %cfb macro:
By selecting the "Resolved" tab in the code panel, you will see the actually executed code that was generated by the macro invocation:
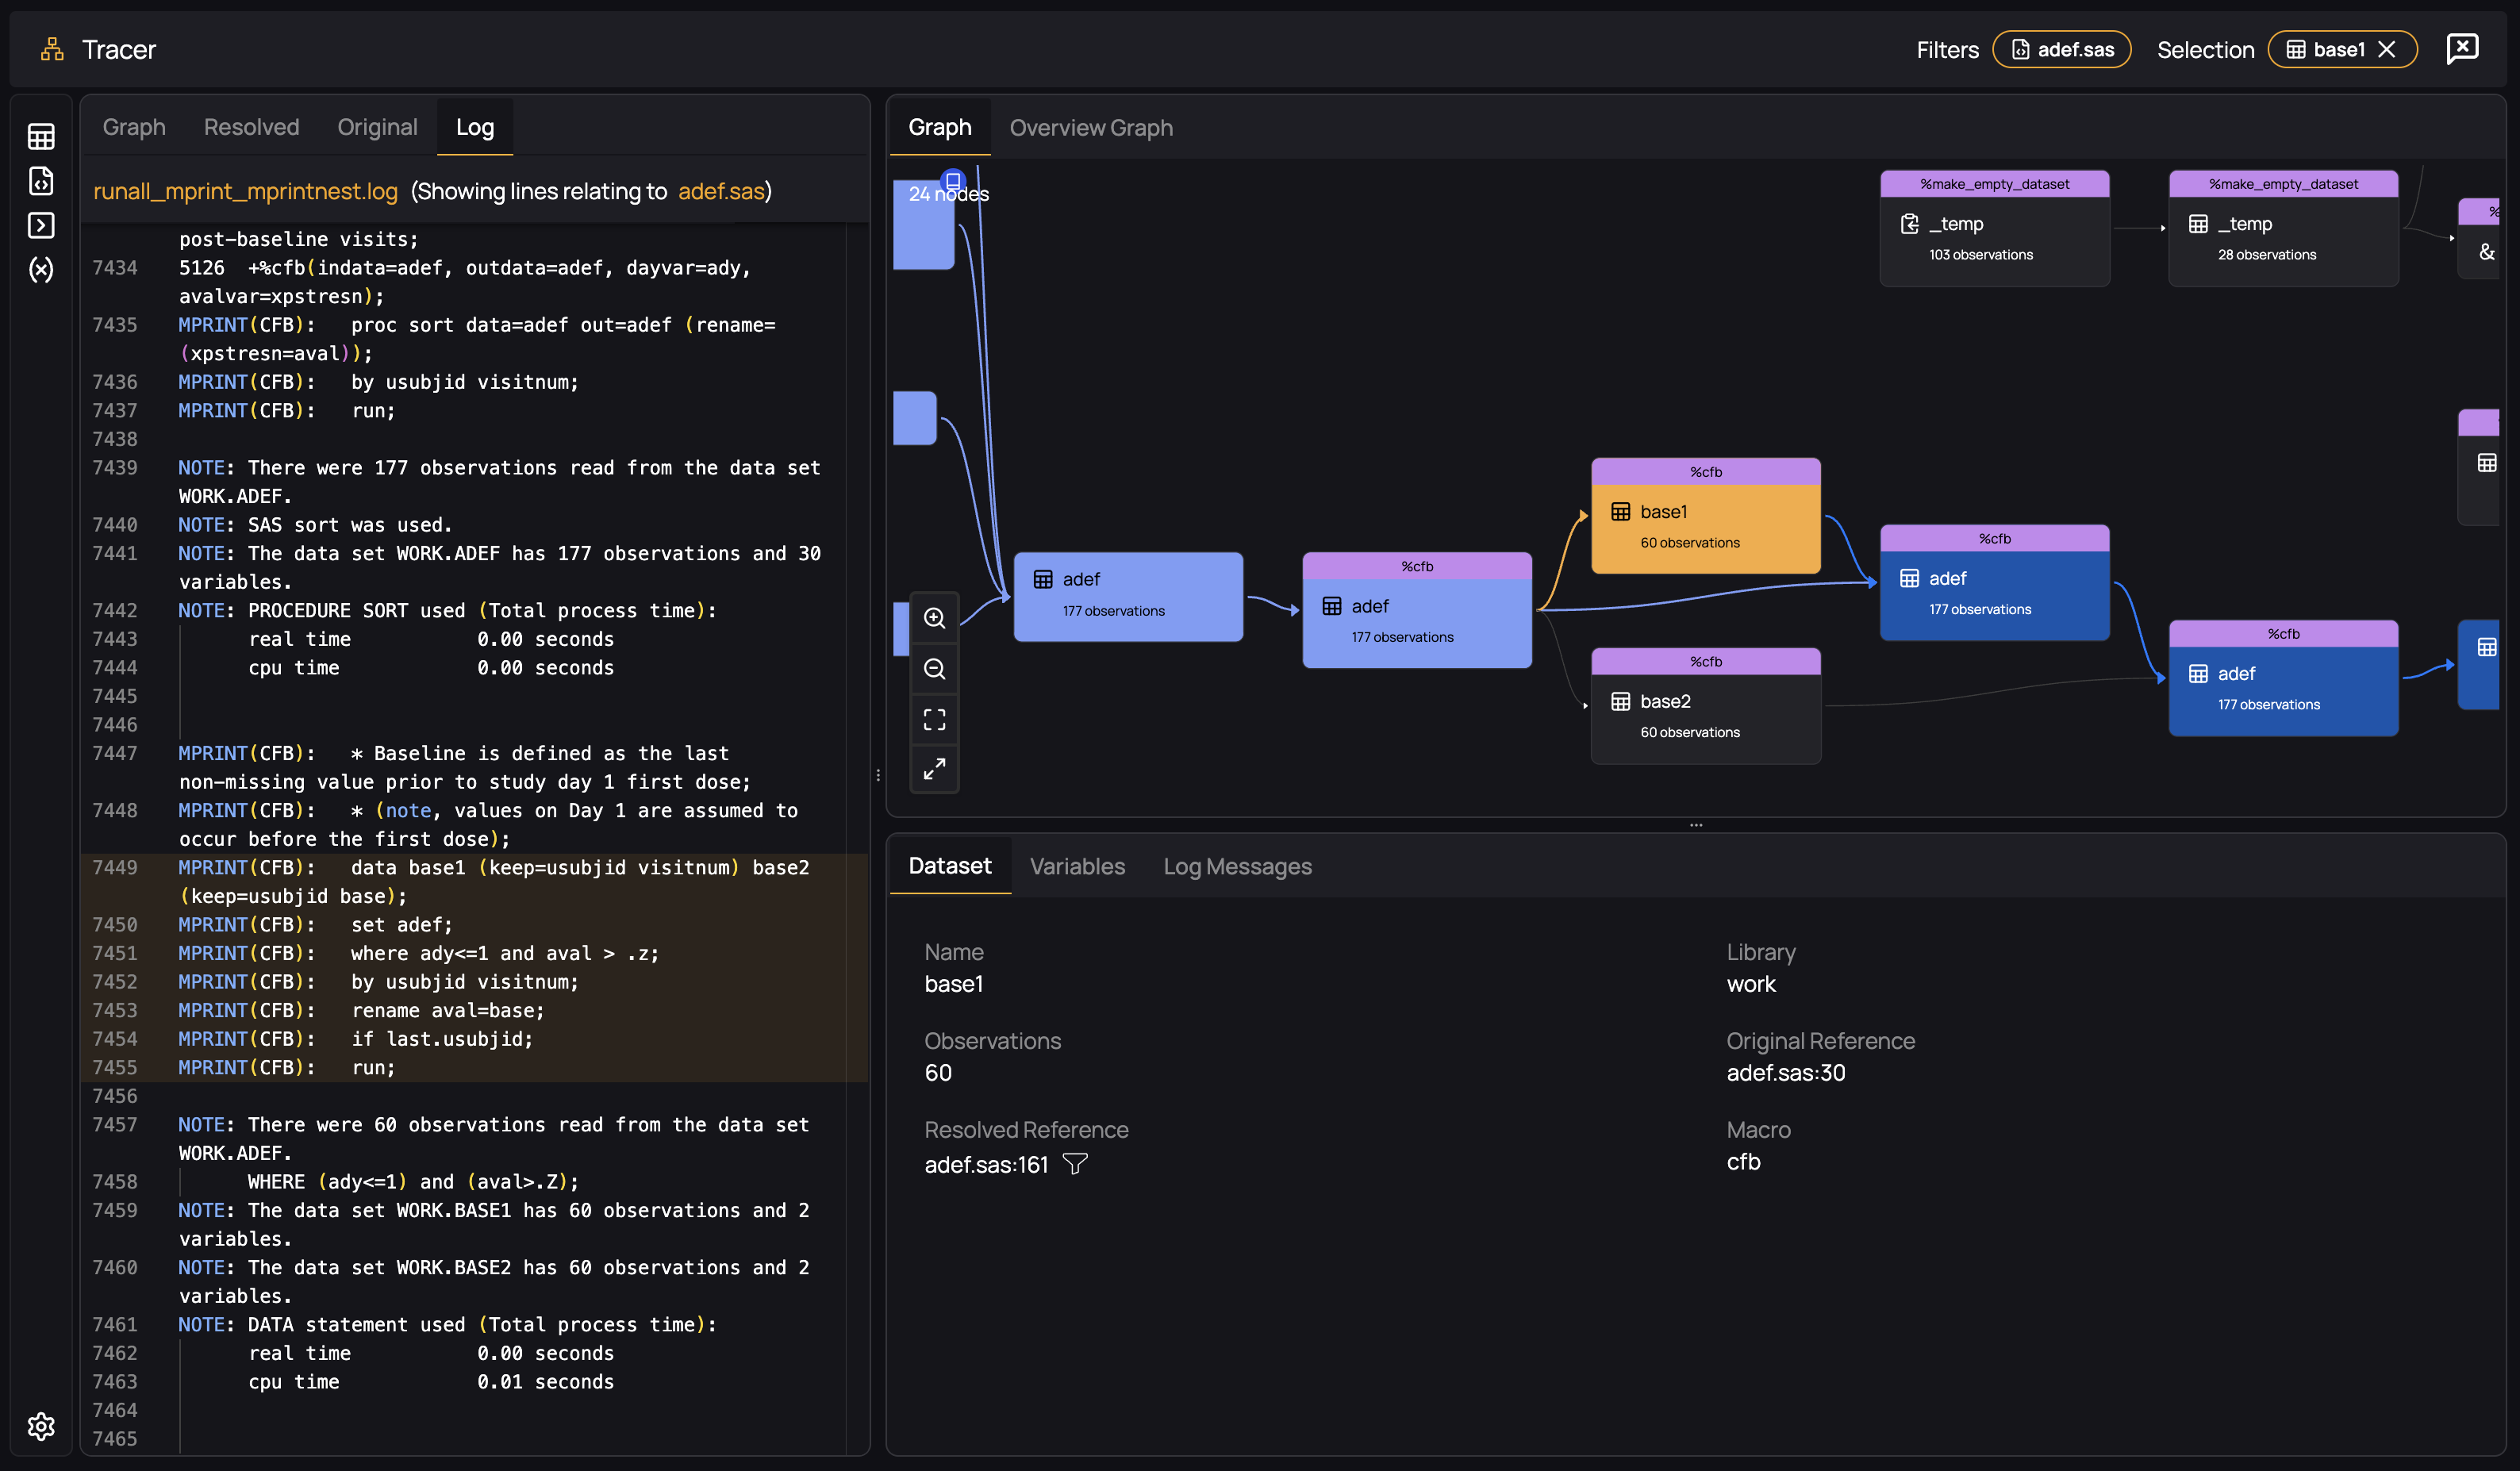
By selecting the "Log" tab, we highlight the part of the log you uploaded from which this macro was resolved - we always display the evidence for any of our features so that you can be confident in its correctness and be able to tell if something is amiss:
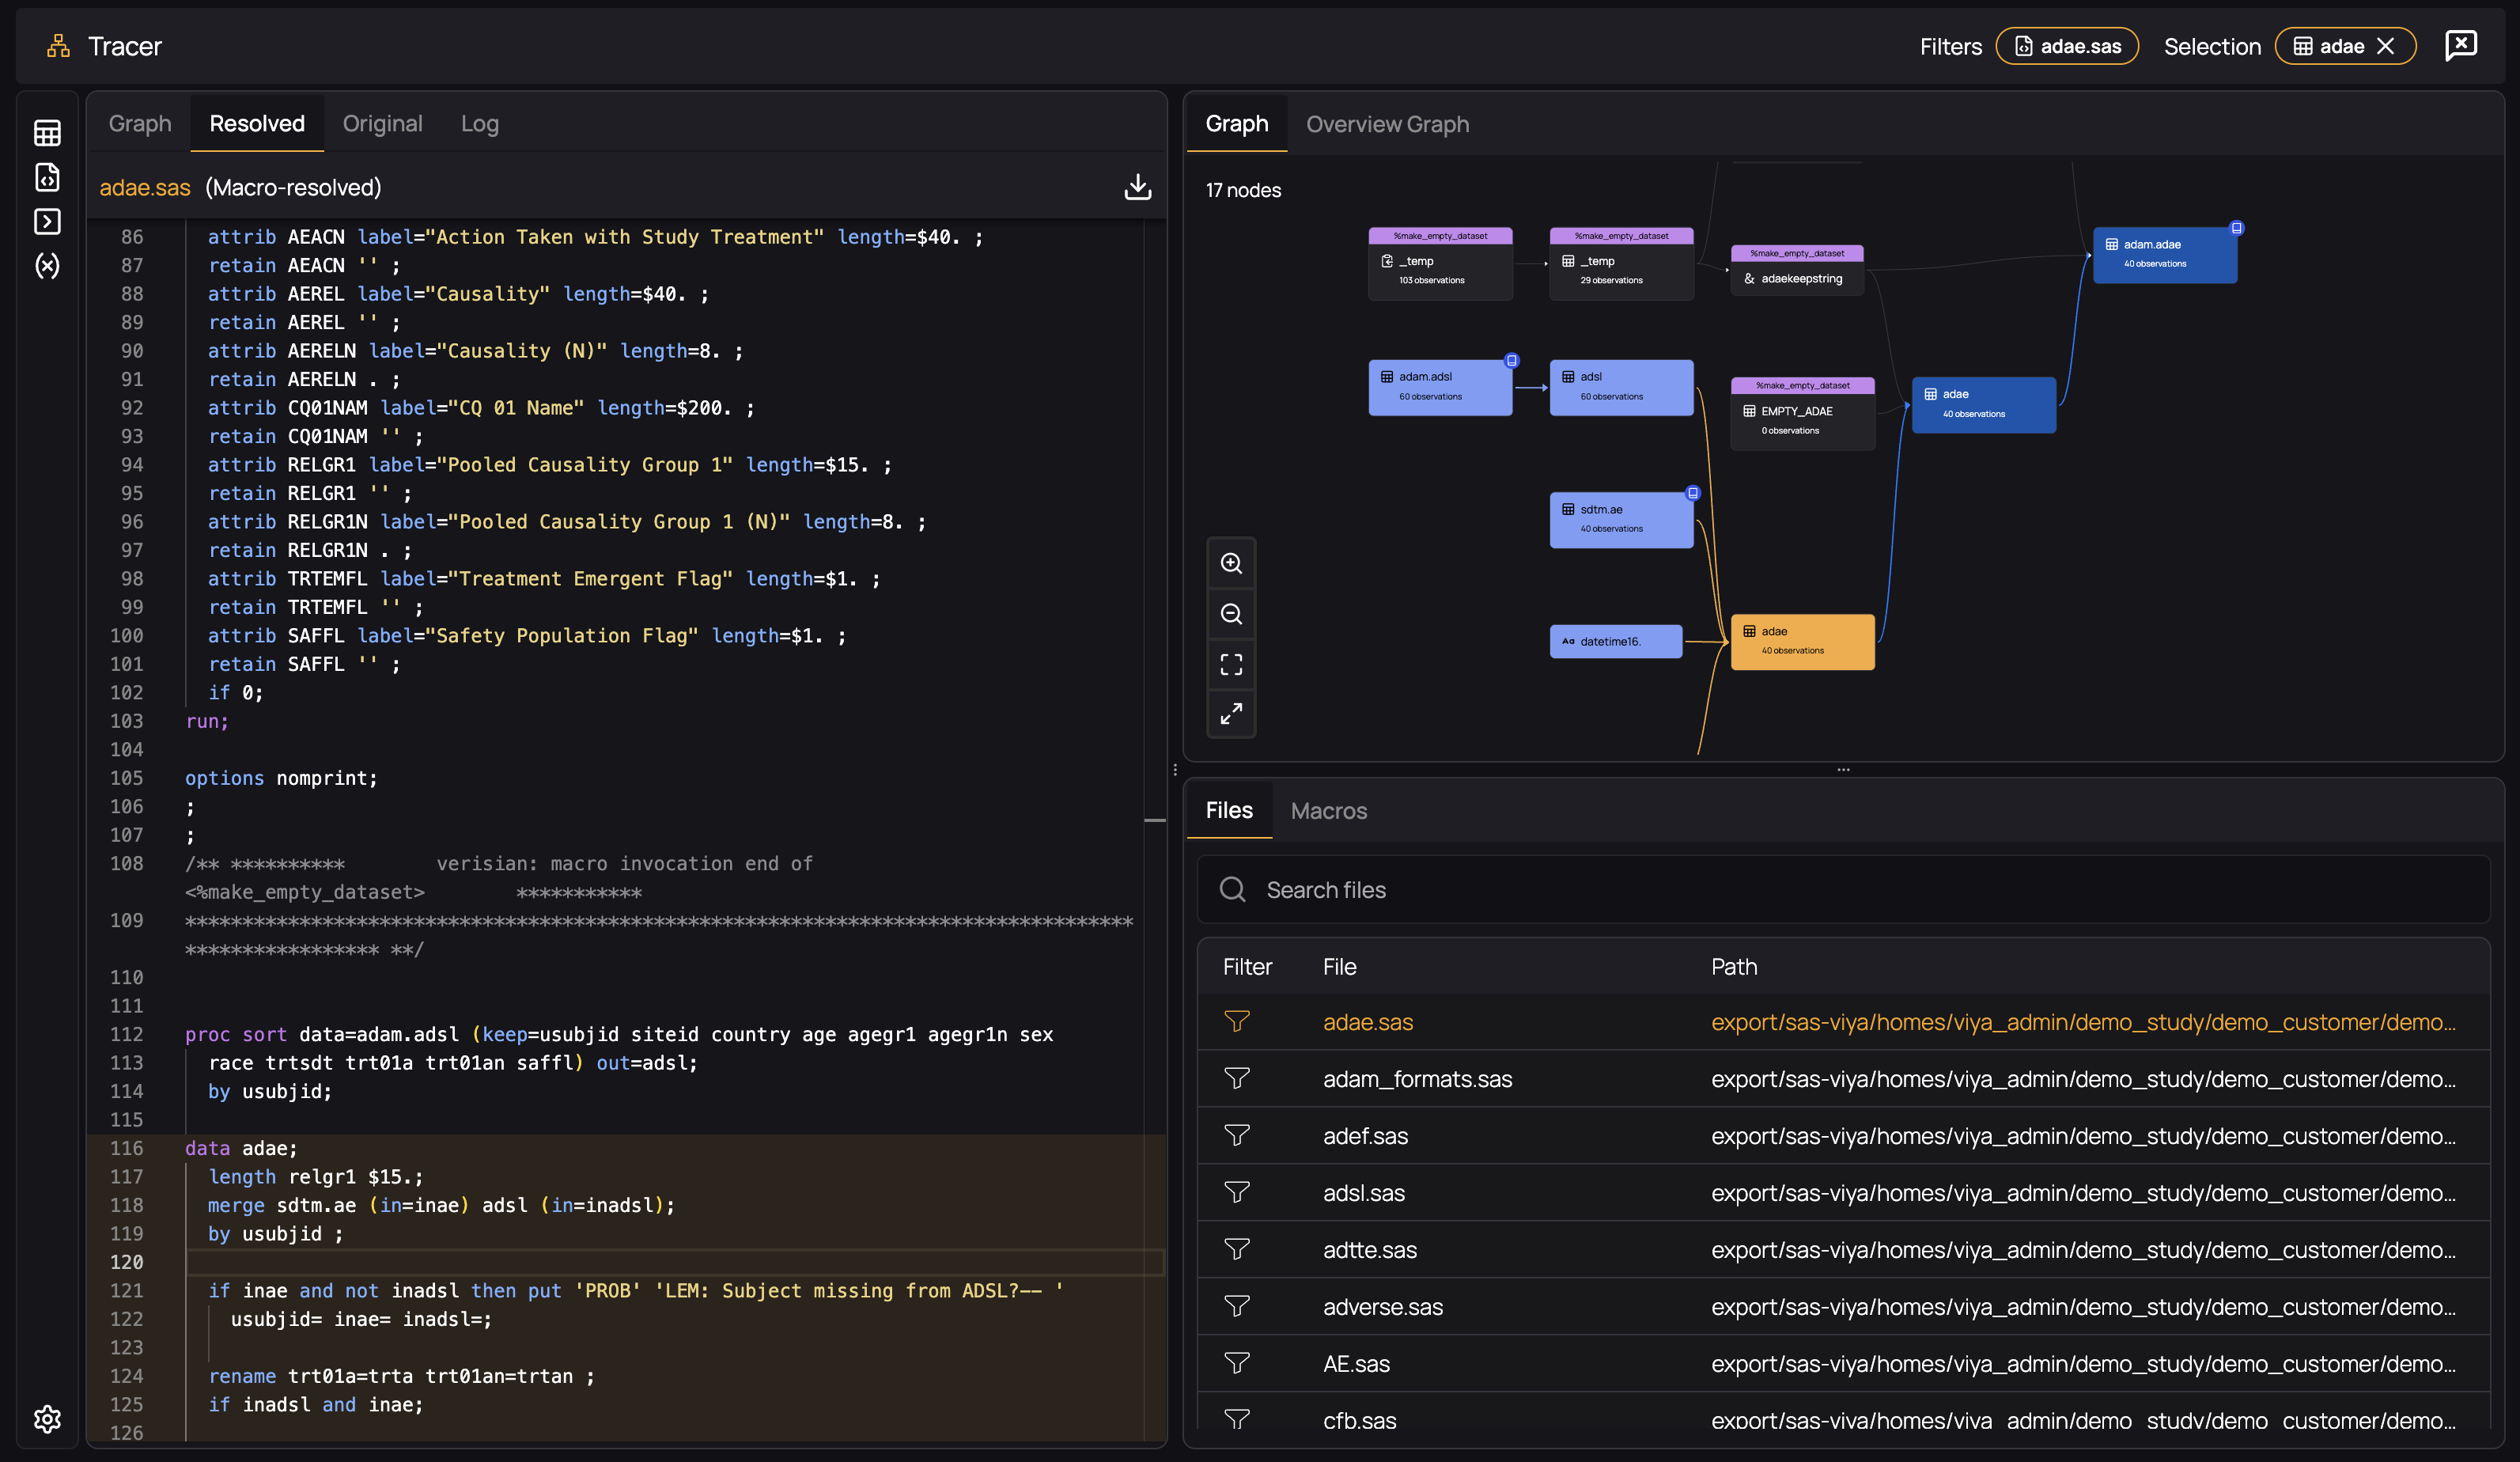
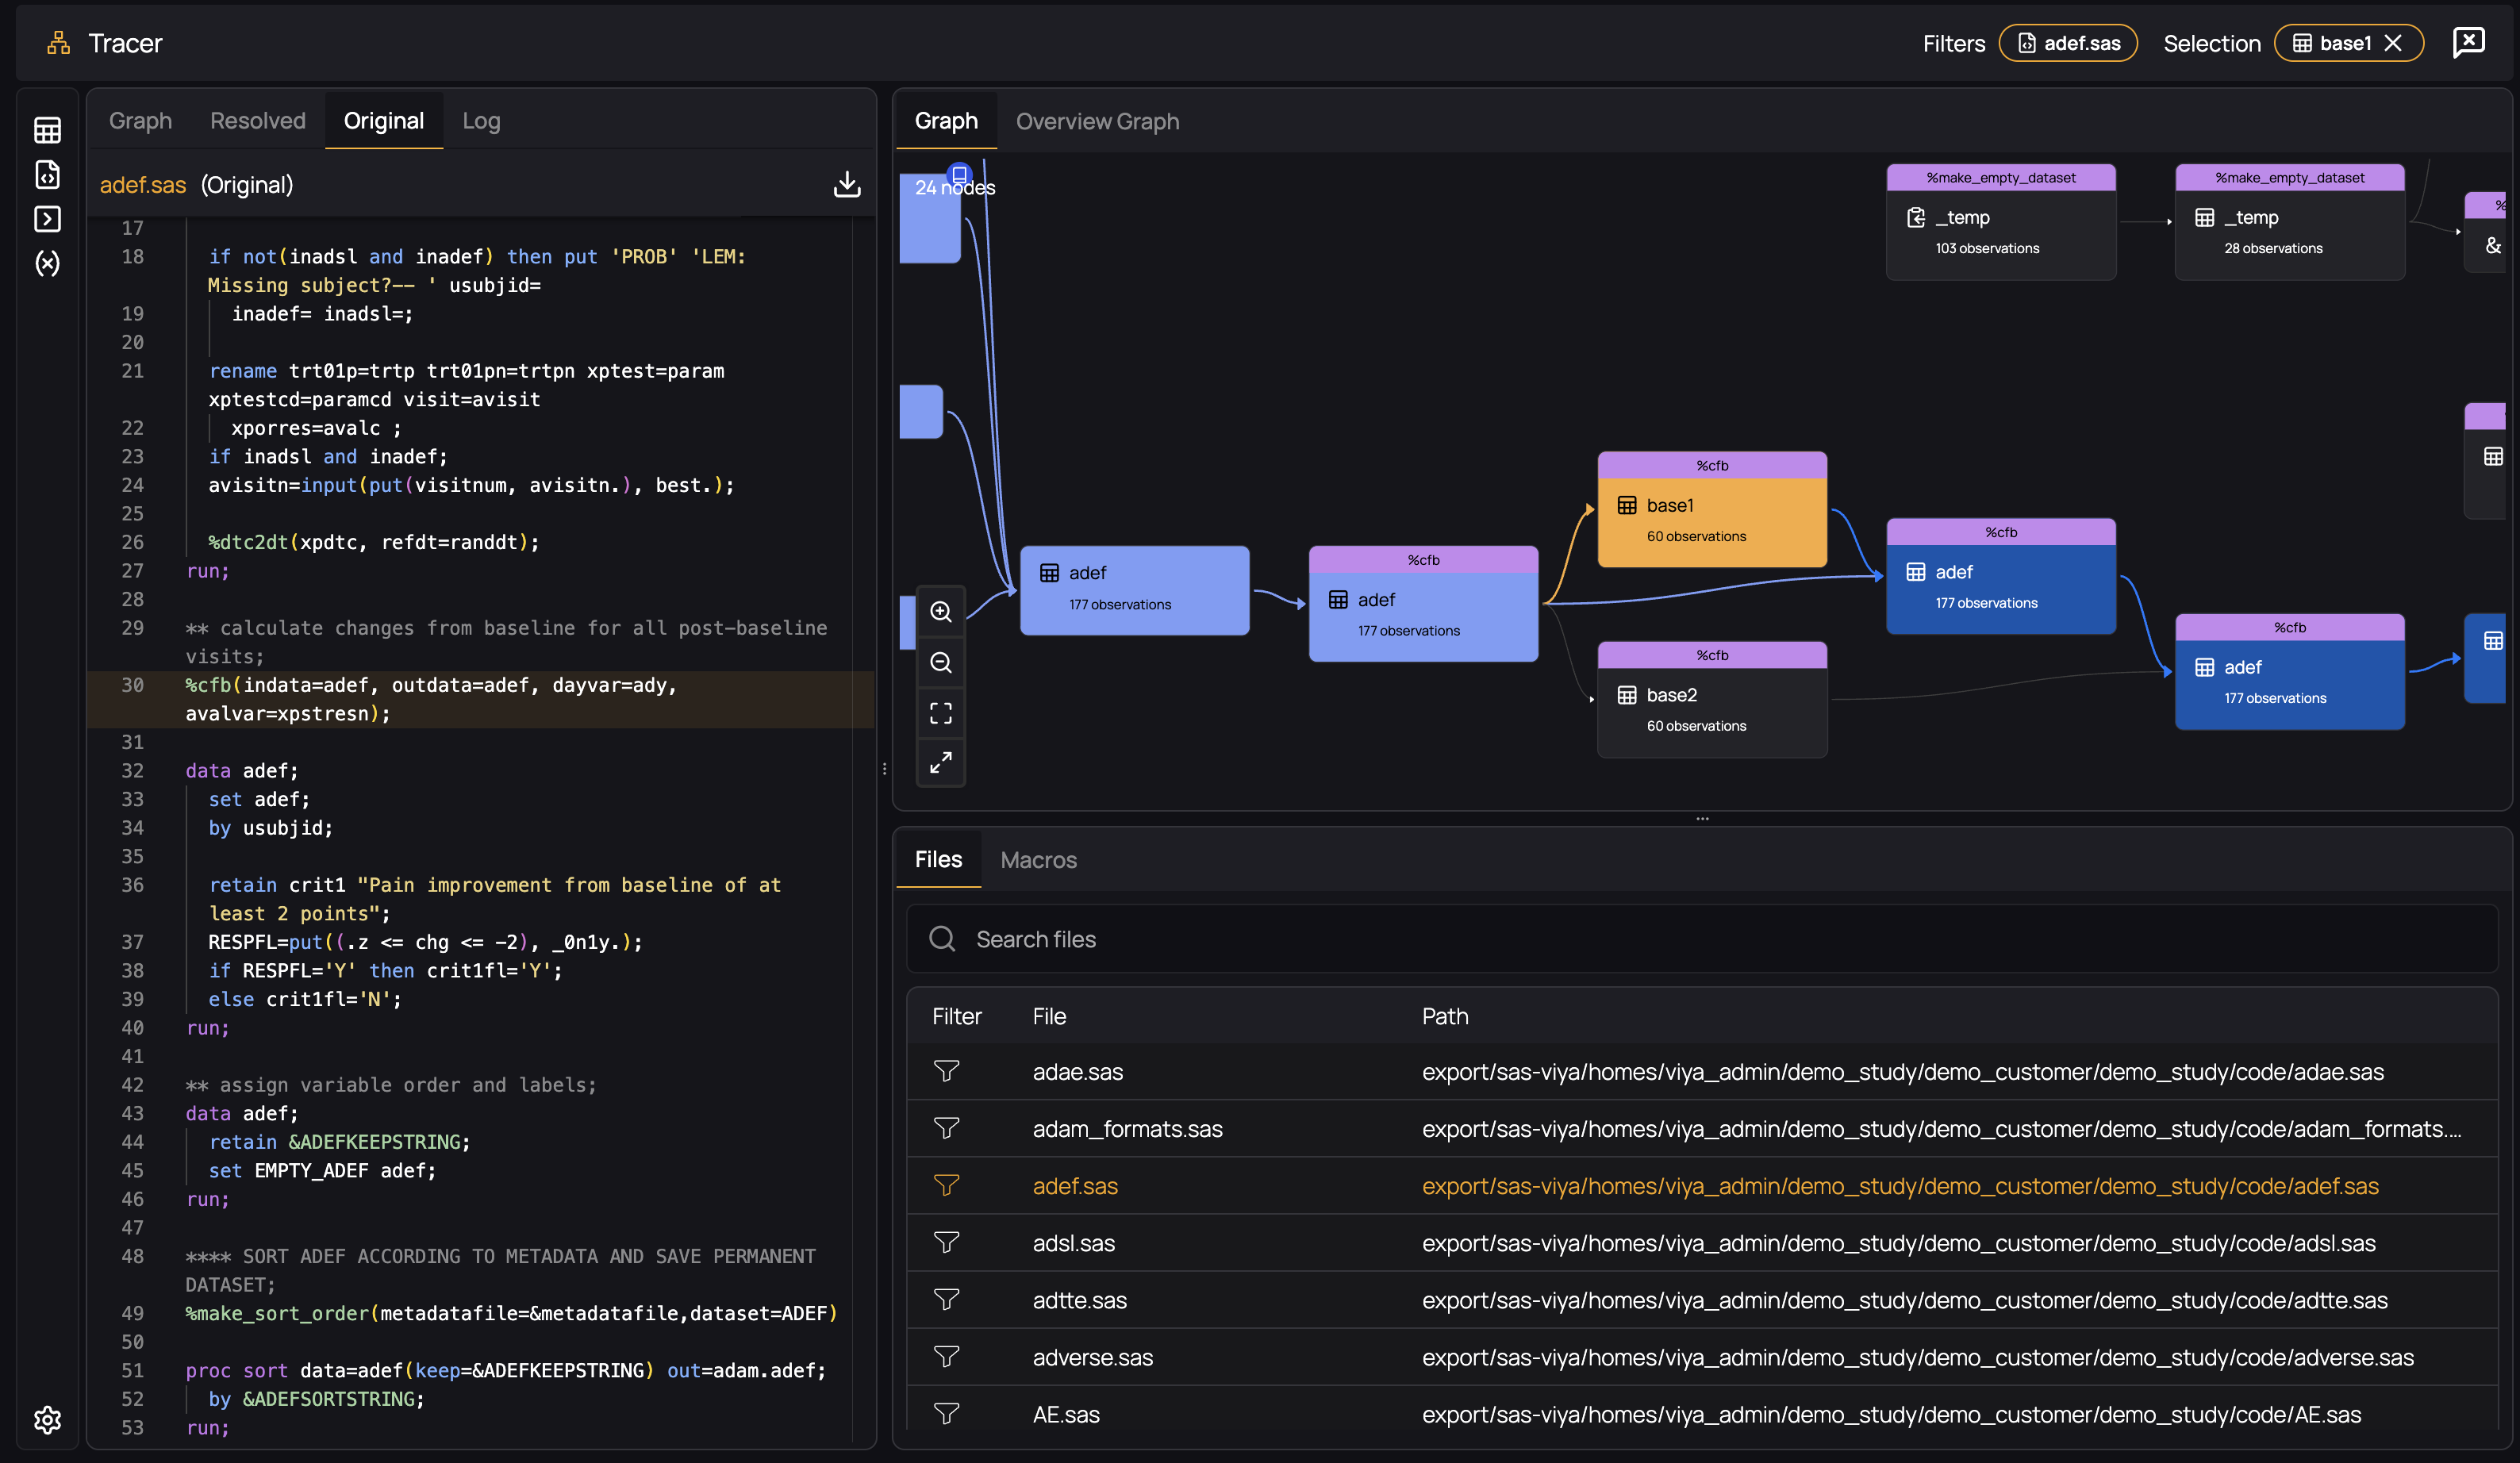
Filtering by Dataset and the Derivation Tab
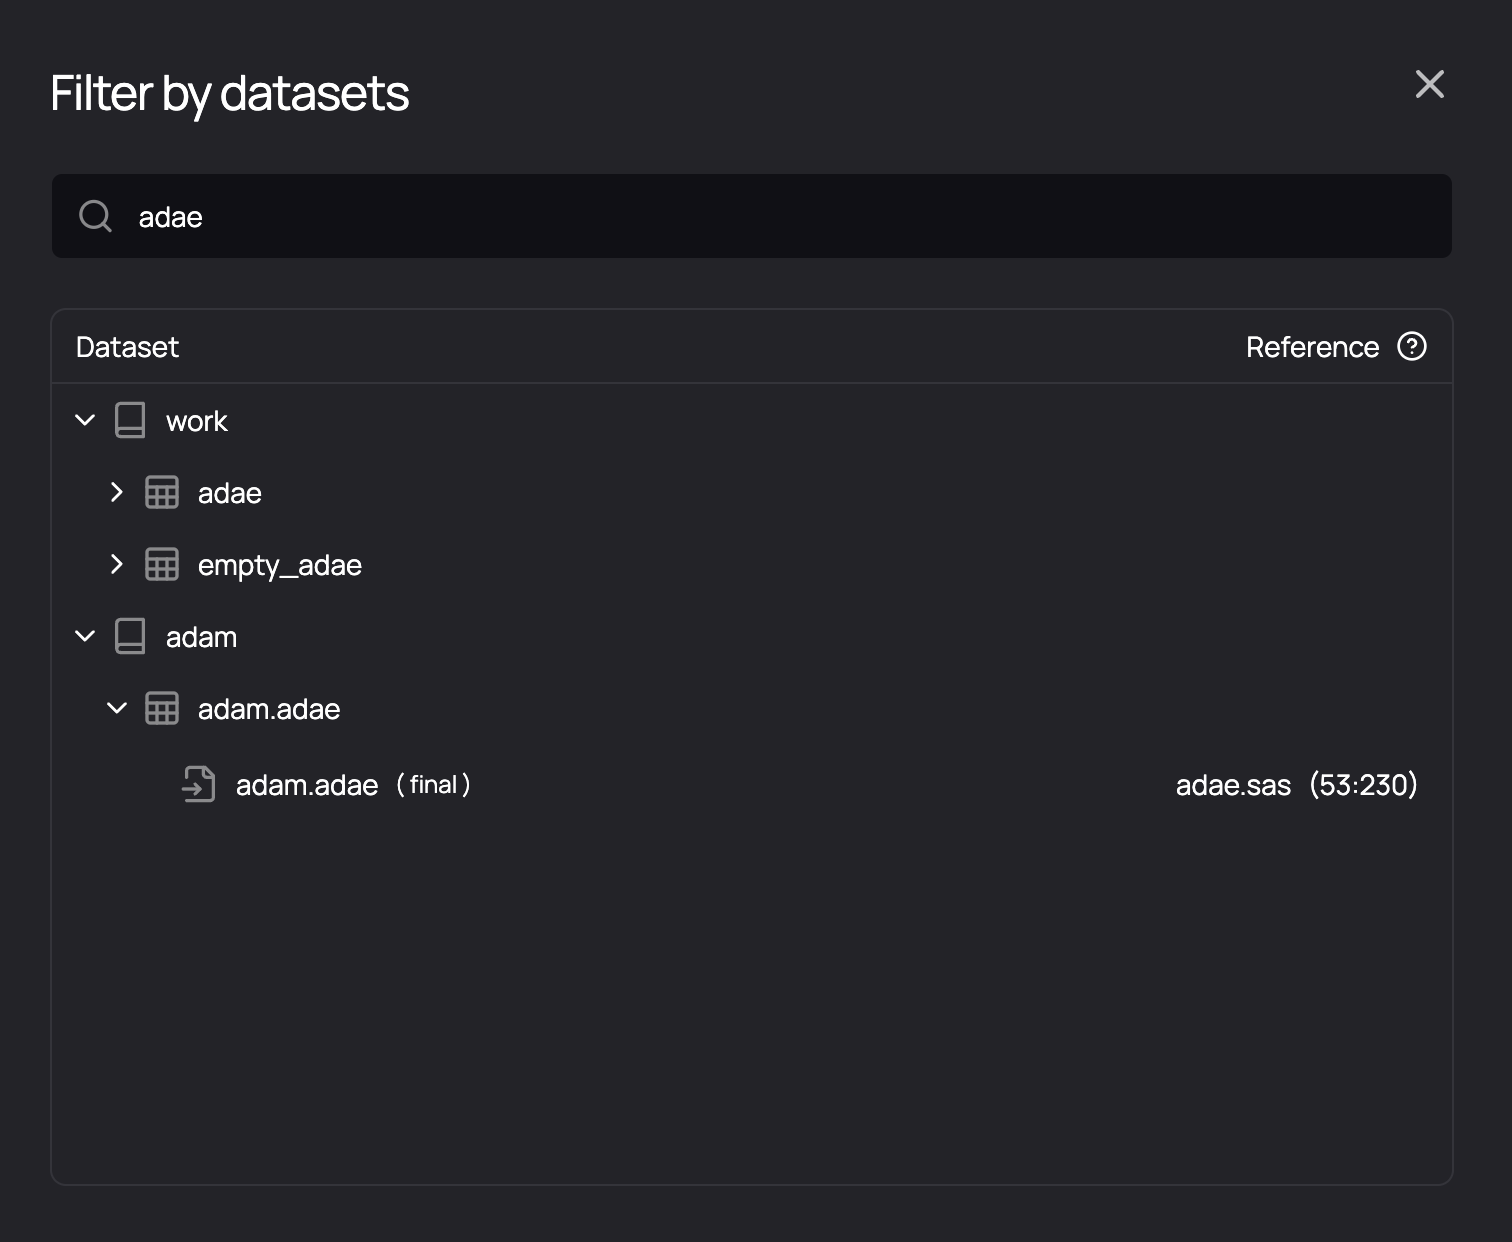
Files do not represent the reality of how datasets interrelate - they are merely the way we organize our code bases. Most often, programmers are not responsible for programs and files, but for a dataset. The second way to filter the graph, therefore, is to select a dataset of interest by clicking the dataset icon in the top right of the graph panel. You can then search for and select a dataset of interest:
The Graph now shows all upstream datasets and the downstream datasets only - it is the slice of the graph that contains only what is relevant to understand your selected dataset, and all datasets that it contributes to.
The code panel represents the graph: it contains only the code, taken from all contributing files, required to produce the selected dataset. It assembles the full derivation of a dataset into a single virtual file that - when read from top to bottom - tells you all you need to know.
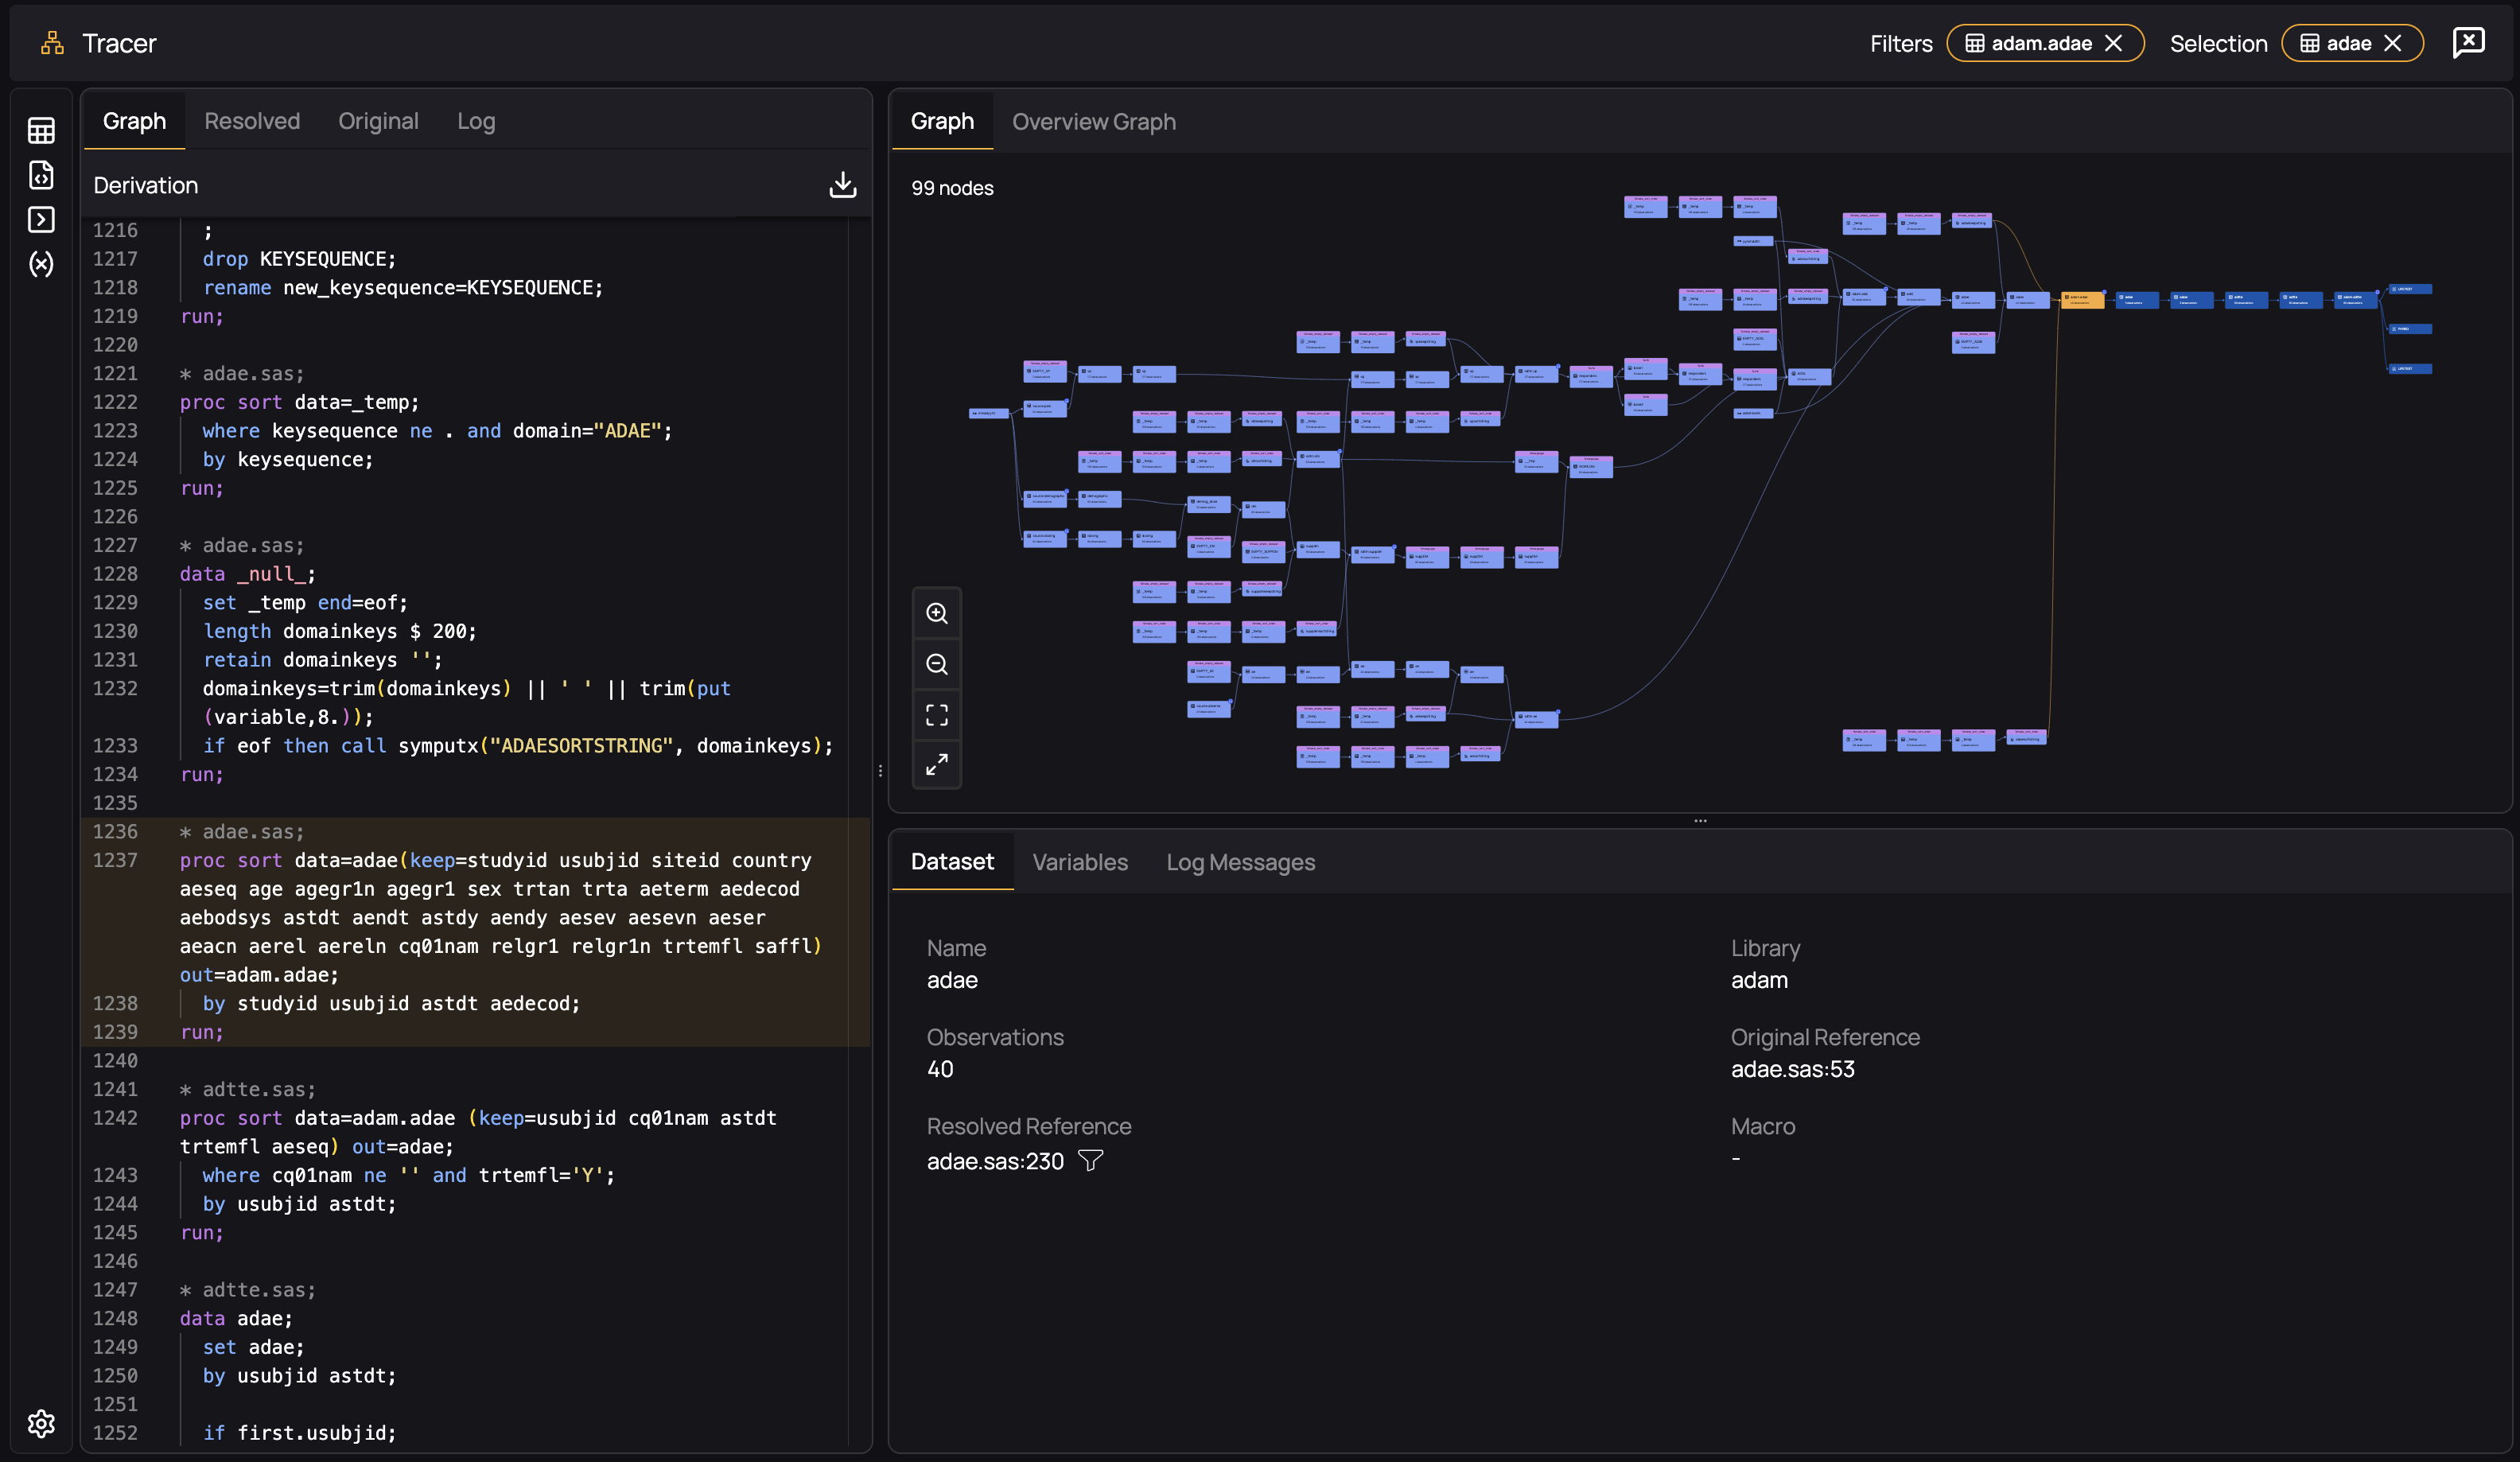
As with file, you can select several datasets to see how their derivations interact by select an additional dataset:
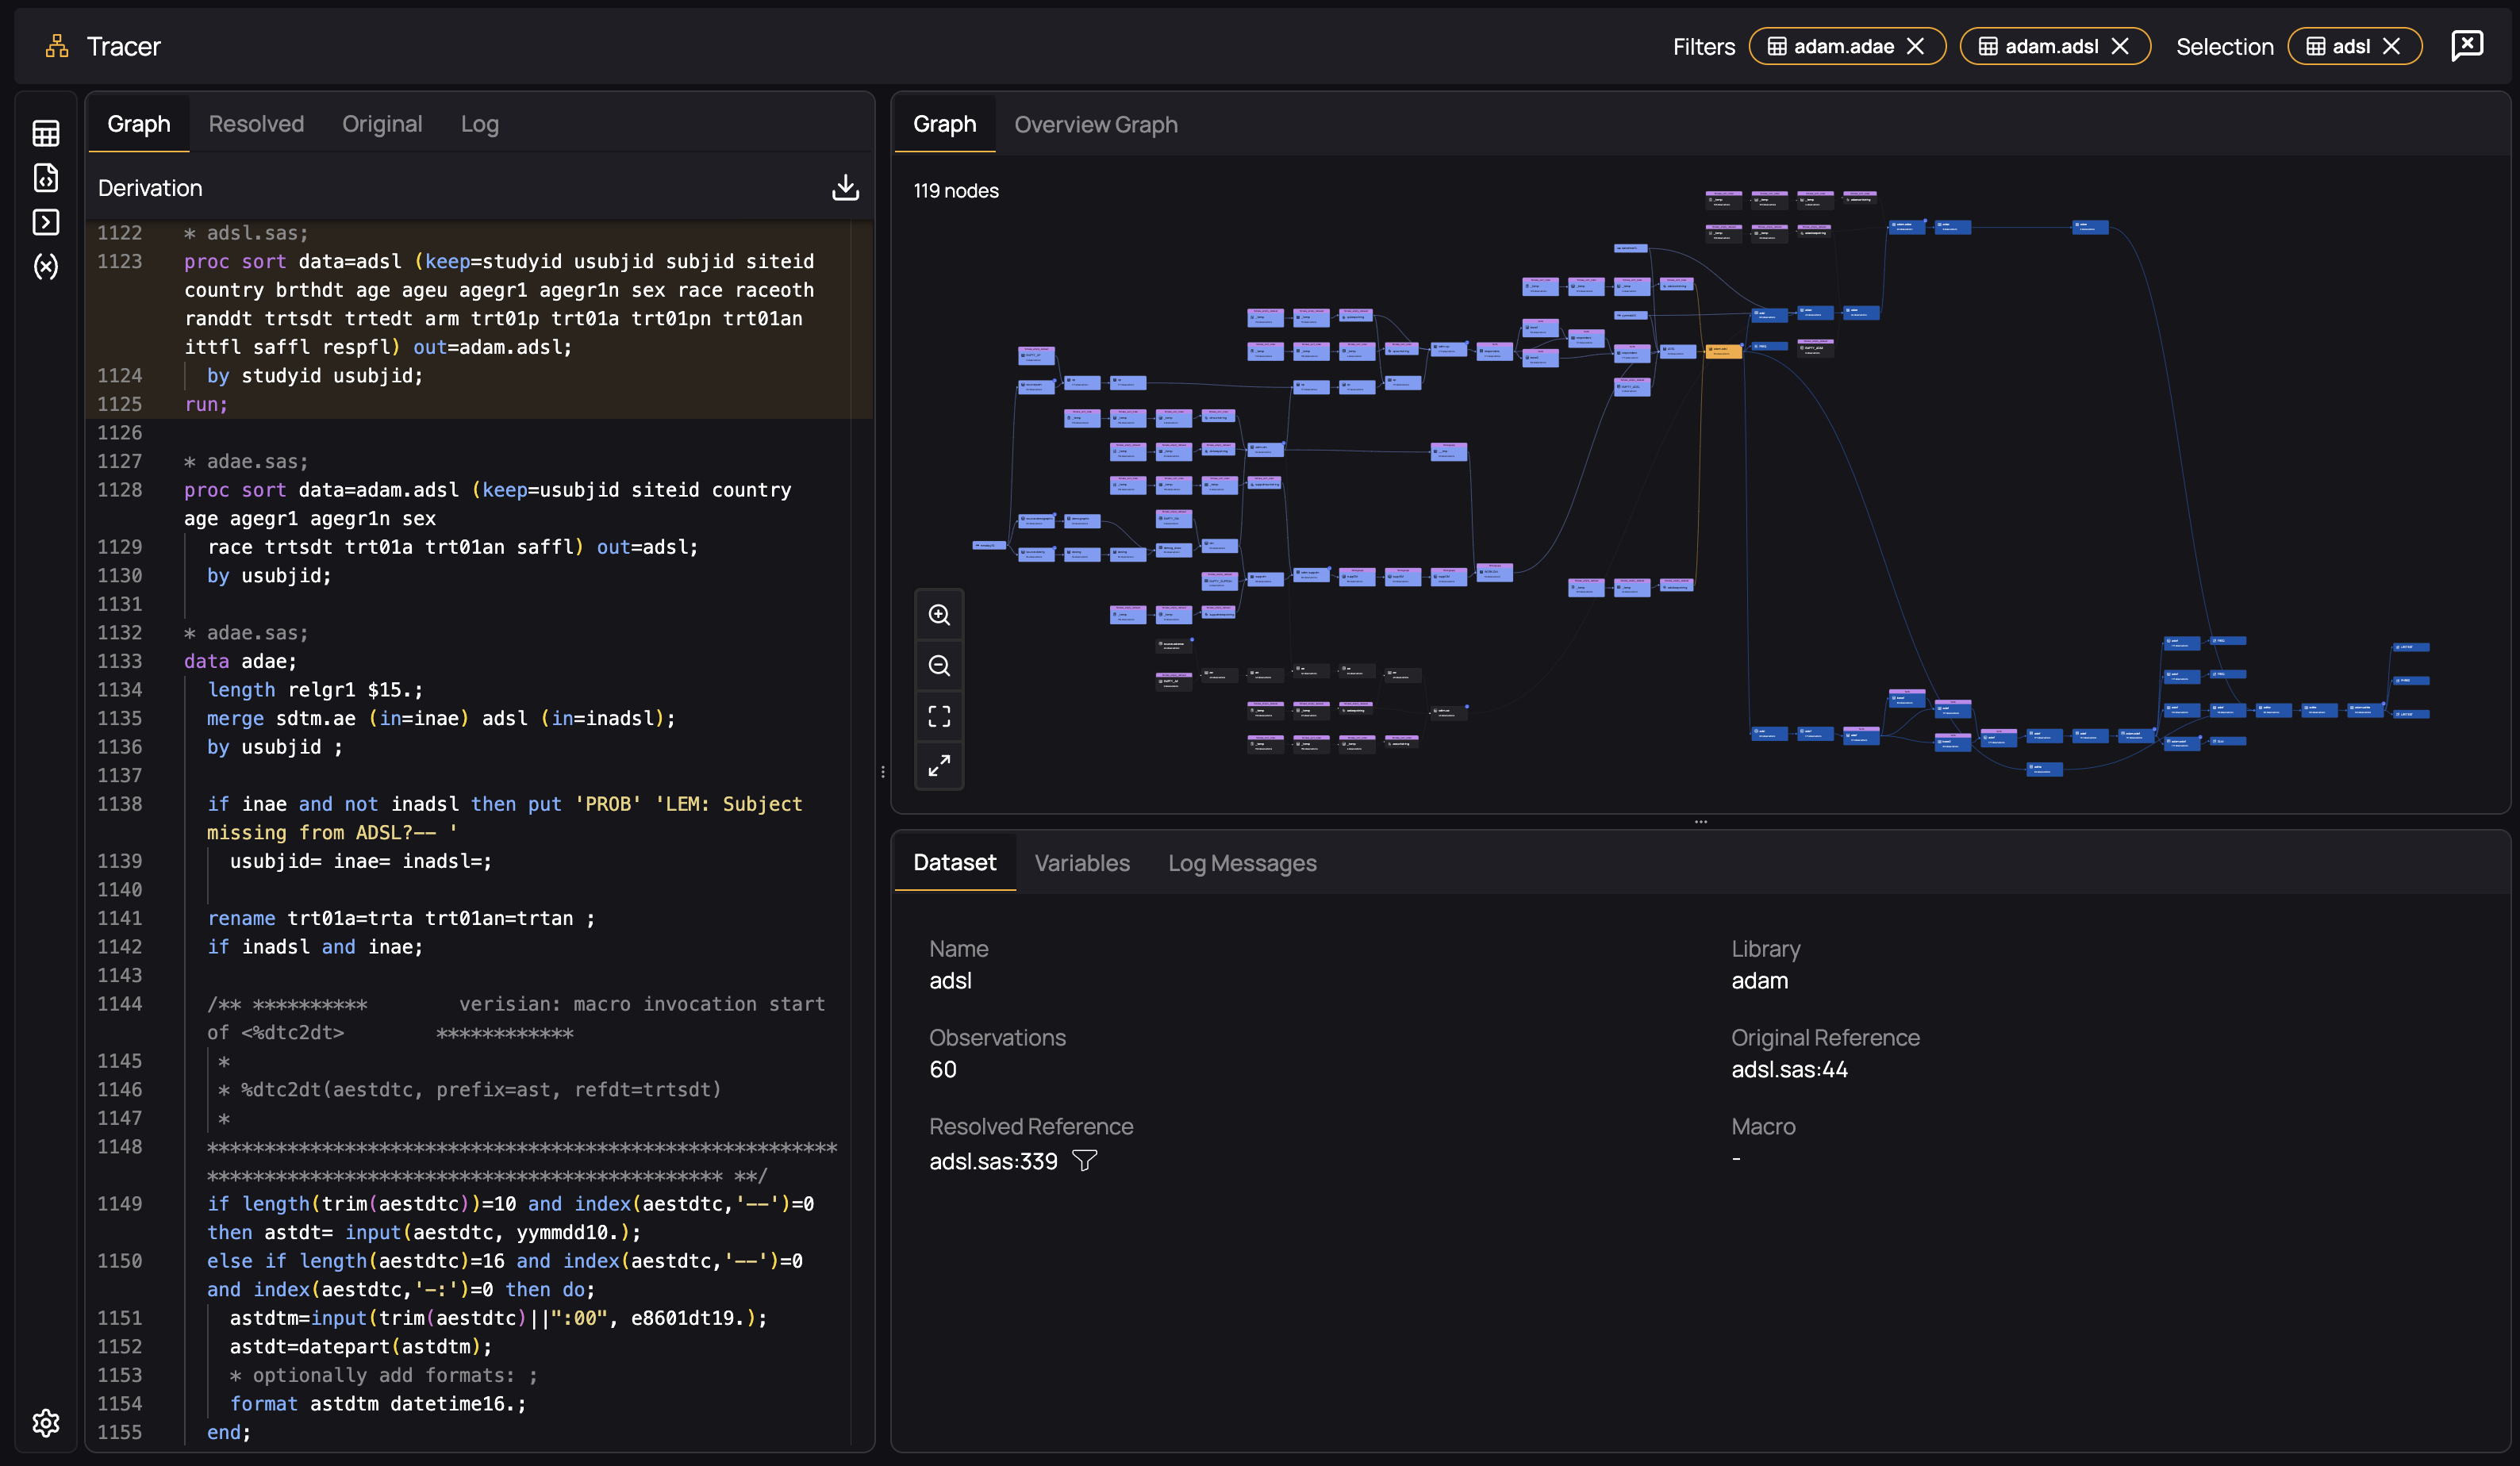
It therefore becomes clear how datasets interrelate, and in which ways they are independent of each other.
Next Steps
This blog has demonstrated dataset-level traceability, showing source datasets, all intermediary datasets, and their downstream effects. To learn about variable-level traceability, please read this article
For more detailed information on Verisian Code Traceability and its impact, see the following blog posts:
ADaM, AI, and Code-Level Traceability
Root Cause Analysis in Clinical Trials


.png)


.svg)
.svg)
.svg)
